On-chain data may suggest short-term Bitcoin holders could be behind the latest correction in the cryptocurrency’s price.
Bitcoin Short-Term Holders Behind The Correction?
As pointed out by a CryptoQuant post, on-chain data may hint that selling from short-term holders might be the drive behind the recent correction.
The relevant indicator here is the Spent Output Profit Ratio (or SOPR in short). This metric shows the total amount of profit or loss that investors are realizing in a given time period.
When the value of this indicator is over one, it means holders are selling their coins at a profit on an average. While values below one would suggest sellers are dumping their Bitcoin at a loss. SOPR values exactly equal to one means the overall market is currently breaking even.
To check whether short-term holders are in the process of profit taking or not, the indicator is modified to take into account the age of the coins.
The short-term supply consists of all the Bitcoin that last moved less than 155 days ago (but more than one hour ago). These coins usually belong to traders who keep intensively shifting their positions with each move in order to maximize their profits.
Related Reading | This Bitcoin Meme Elon Musk Reposted Sold As An NFT For Almost $20k In WETH
The SOPR for investors like these is called the STH-SOPR (STH standing for Short-Term Holder). The below chart shows the trend in the value of this indicator over the last few months.
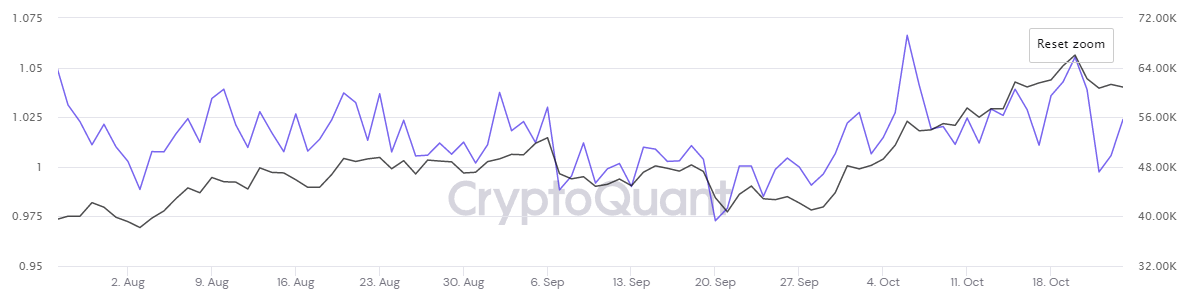
BTC's short-term SOPR vs the price trend | Source: CryptoQuant
As the above graph shows, when Bitcoin made its new ATH around $67k, the STH-SOPR’s value also showed a significant spike up.
This implies that these short-term investors took the opportunity of BTC’s big move up to realize some of their profits. And with the timing of the correction following soon after, it’s possible the cause of the dip was this selling by these investors.
Related Reading | Can “Coin Days Destroyed” Indicator Predict Bitcoin Tops?
BTC Price
At the time of writing, Bitcoin’s price floats around $63k, up 1% in the last seven days. Over the last month, the crypto has accumulated 49% in gains.
Here is a chart showing the trend in the value of the coin over the last five days:
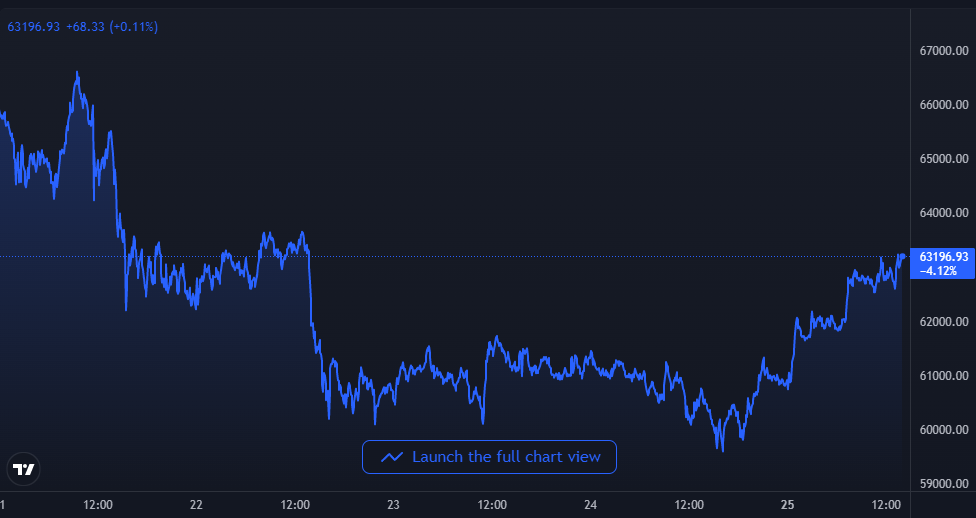
BTC's price seems to be going up the path of recovery from the correction | Source: BTCUSD on TradingView
A few days ago, Bitcoin successfully set a new all-time high (ATH) of around $67k, but it didn’t take long until the crypto’s price saw a correction.
It’s possible that this dip was caused by short-term holders, as the previous chart hints. Long-term holders remaining bullish can take BTC to even higher ATHs. And looking at the price chart, it may seem that the recovery has already begun.
Featured image from Unsplash.com, charts from TradingView.com, CryptoQuant.com