Bitcoin on-chain data shows that the BTC outflows have been gradually heading downwards recently, hinting that a crash could be coming soon.
On-Chain Data Shows BTC Outflows Continue To Decrease
As pointed out by an Analyst on Twitter, on-chain data reveals Bitcoin outflows have been gradually going down in the past month.
The relevant metric here is the BTC netflows. This indicator shows the net amount of coins exiting or entering exchange wallets. Its value is calculated by taking the difference between the inflows and the outflows.
When the netflow shows negative values, it means outflows are dominating inflows. This means more Bitcoin is being pulled off exchanges than the amount being put in. Sustained such values have usually been bullish for the crypto.
Positive values, on the other hand, would imply an increase in coins entering exchanges as inflows show more strength than outflows. This can be bearish for BTC’s price.
Related Reading | Bitcoin Price Smashes Record For Highest Weekly Candle Close Ever
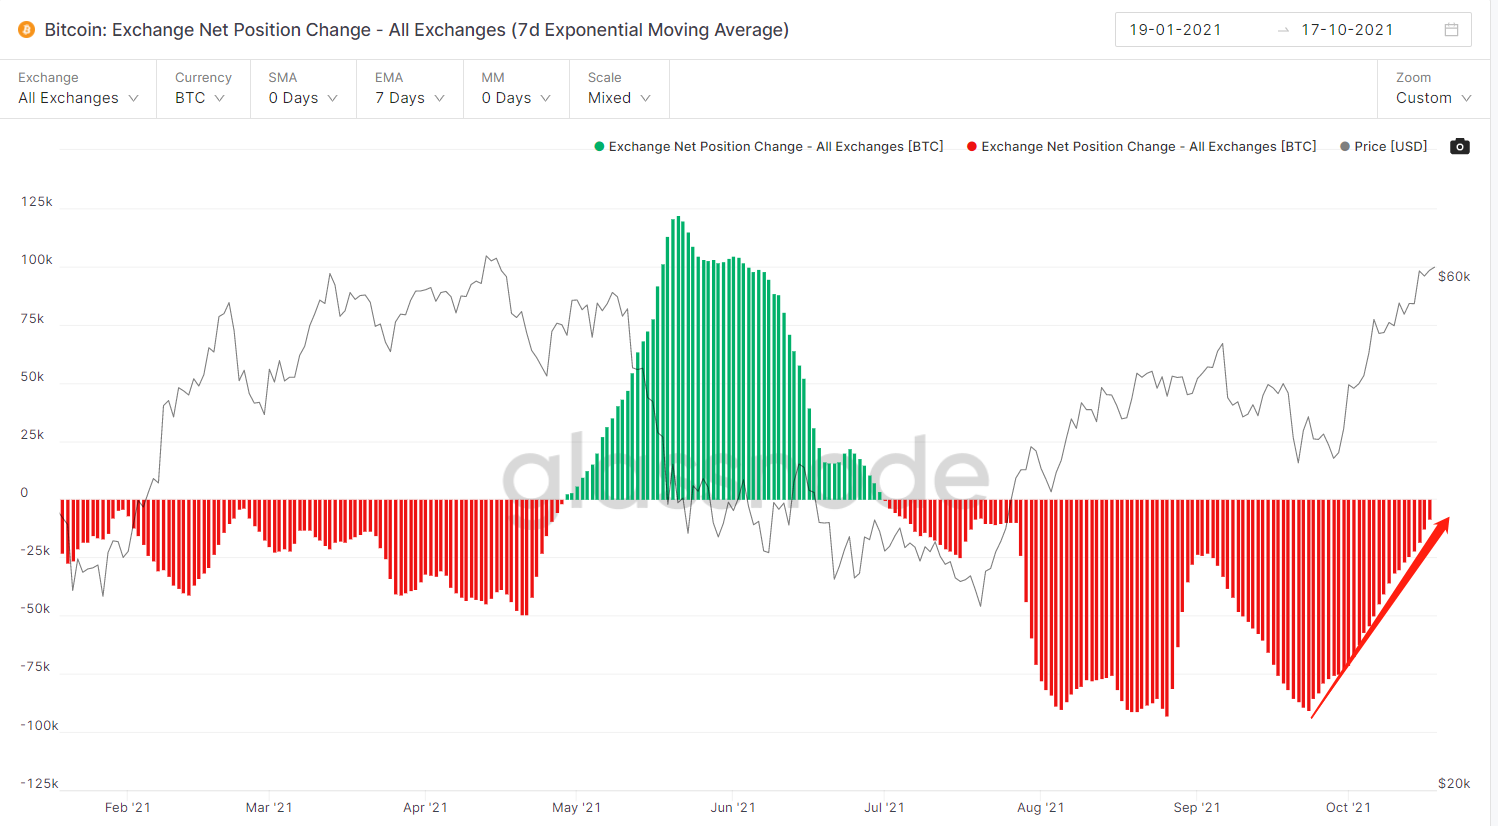
Now, here is a chart that shows the trend in the value of the BTC netflows over the year:

BTC's outflows seem to be decreasing | Source: Glassnode
As the above graph shows, Bitcoin saw significant outflows over the last couple of months, but lately they have started slowing down.
It seems that during the 2021 bull run, outflows were seen for much of the period. Once netflows started turning green (that is, investors started sending their coins to exchanges for selling), the price crash happened.
If outflows keep going down like they are right now, the indicator might turn back green again. This could lead to another price crash happening soon.
Related Reading | The On-Chain Metric That Says Bitcoin Is About To Go “Parabolic”
However, it should be noted that the netflows became similarly neutral at many points during the last bull run, but no major correction came. So it remains to be seen if this time the indicator will turn positive or not.
Bitcoin Price
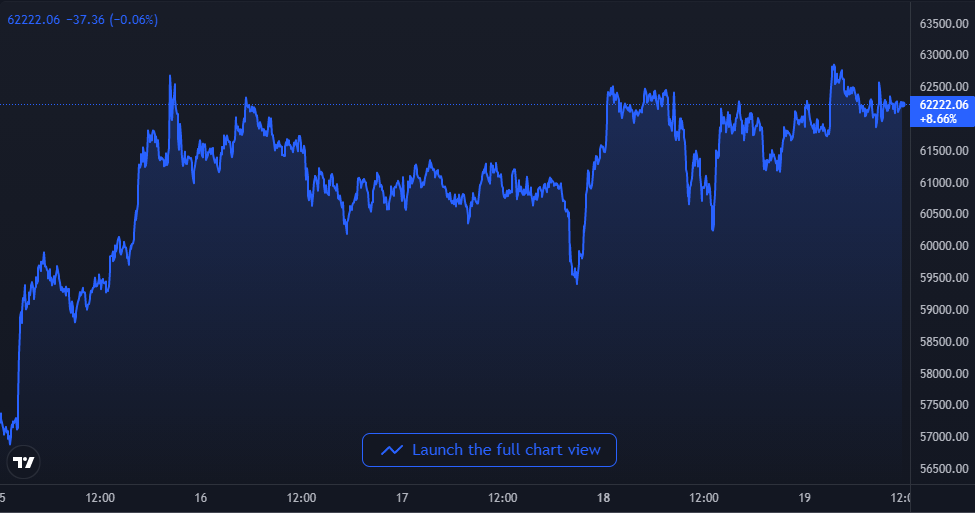
At the time of writing, BTC’s price floats around $62k, up 9% in the last seven days. Over the last month, the crypto has gained 31% in value.
The below chart shows the trend in the price of Bitcoin over the last five days:

BTC's price shows a rather sideways movement over the last few days | Source: BTCUSD on TradingView
After a September filled with multiple crashes, Bitcoin has made some big moves up in this month of October as the crypto is now very close to making a new all time high (ATH). It’s unclear where the coin might head next, but if the netflows start turning positive, a crash could be coming soon.
Featured image from Unsplash.com, charts from TradingView.com, Glassnode.com
 newsbtc.com