As August comes to an end, it heralds the arrival of a historically negative month for Bitcoin. Does this make September a perfect time to buy Bitcoin? September stands out as the only month in the past decade that has had a negative performance on average for Bitcoin price, and this has caught the attention of investors.
The Only Month with Negative Average for Bitcoin
During this period, Bitcoin experienced an average decline of 5.5%. While some see this as a discouraging trend, others interpret it as a suitable opportunity for strategic investment. These figures are visually represented in the table below. The numbers reflect the percentage change compared to the previous month. Although August 2023 has not yet ended, Bitcoin price has declined by approximately 11% compared to August 1st.
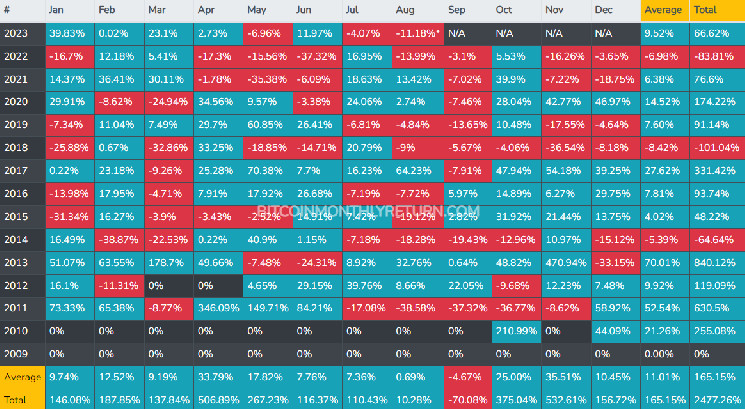
The data clearly shows significant price fluctuations in Bitcoin over the years. For example, in November 2013, there was a significant increase of 470.94%, while in the same month in 2018, there was a decrease of 36.54%. This pattern holds true for other months as well, but September’s negative data is particularly noteworthy.
Bitcoin Price Trend Over the Years
In general, the table highlights certain trends. For instance, Bitcoin price exhibits significant ups and downs in certain years, while in other years, fluctuations are less pronounced. In addition, the average percentage change on a monthly basis varies annually, with notable increases observed in 2013, 2017, and 2021 over the past decade.
When observing the monthly performance of Bitcoin, there may not be much to emphasize beyond the averages. However, an important observation can be made when analyzing the annual performance. Interestingly, these years are immediately followed by halving events. If historical patterns continue, a significant increase can be expected in 2025, considering the halving event planned for 2024. Representing this on a logarithmic price chart could potentially yield a visual similar to the one below:
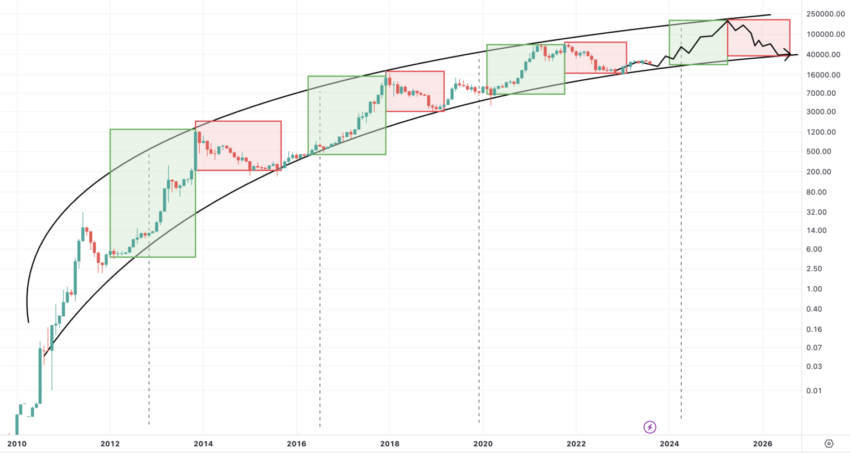
The dashed lines in the graph indicate the halving events, while the prominent green segments represent significant price increases in 2013, 2017, and 2021. The graph also includes a speculative projection for the year 2025. The latter is a hypothetical example aiming to depict a potential scenario.
When considering the possibility of buying Bitcoin based on historical price patterns in September, it is important to exercise caution. While past trends can provide valuable insights, the cryptocurrency market is highly volatile and influenced by numerous factors. Relying solely on past September performance may not encompass the current market environment and emerging dynamics. Utilizing a more comprehensive strategy that combines historical analysis with broader market indicators and evolving news trends would likely be a prudent approach.