You might also like
Top NFT Marketplace Daily Users, Sales Hit New Lows Not Seen Since 2021
Bitcoin Hits $30K, Marking Highest Price Since June 2022
Bitcoin (BTC) has experienced an impressive rally of almost 60% in 2023, reaching around $27,000, mainly due to expectations that the Federal Reserve would halt its quantitative tightening program amid the U.S. banking crisis. However, despite the uptrend, the BTC price has yet to break decisively beyond the $30,000 level.
In the past week, buying exhaustion at this critical psychological level has triggered a price correction, sending BTC back to $25,000. Interestingly, this decline has strengthened Bitcoin’s correlation with several traditional financial metrics. The question is whether this increases the likelihood of Bitcoin continuing its downtrend in Q2. Let’s examine this possibility more closely.
USD Index’s Double Bottom
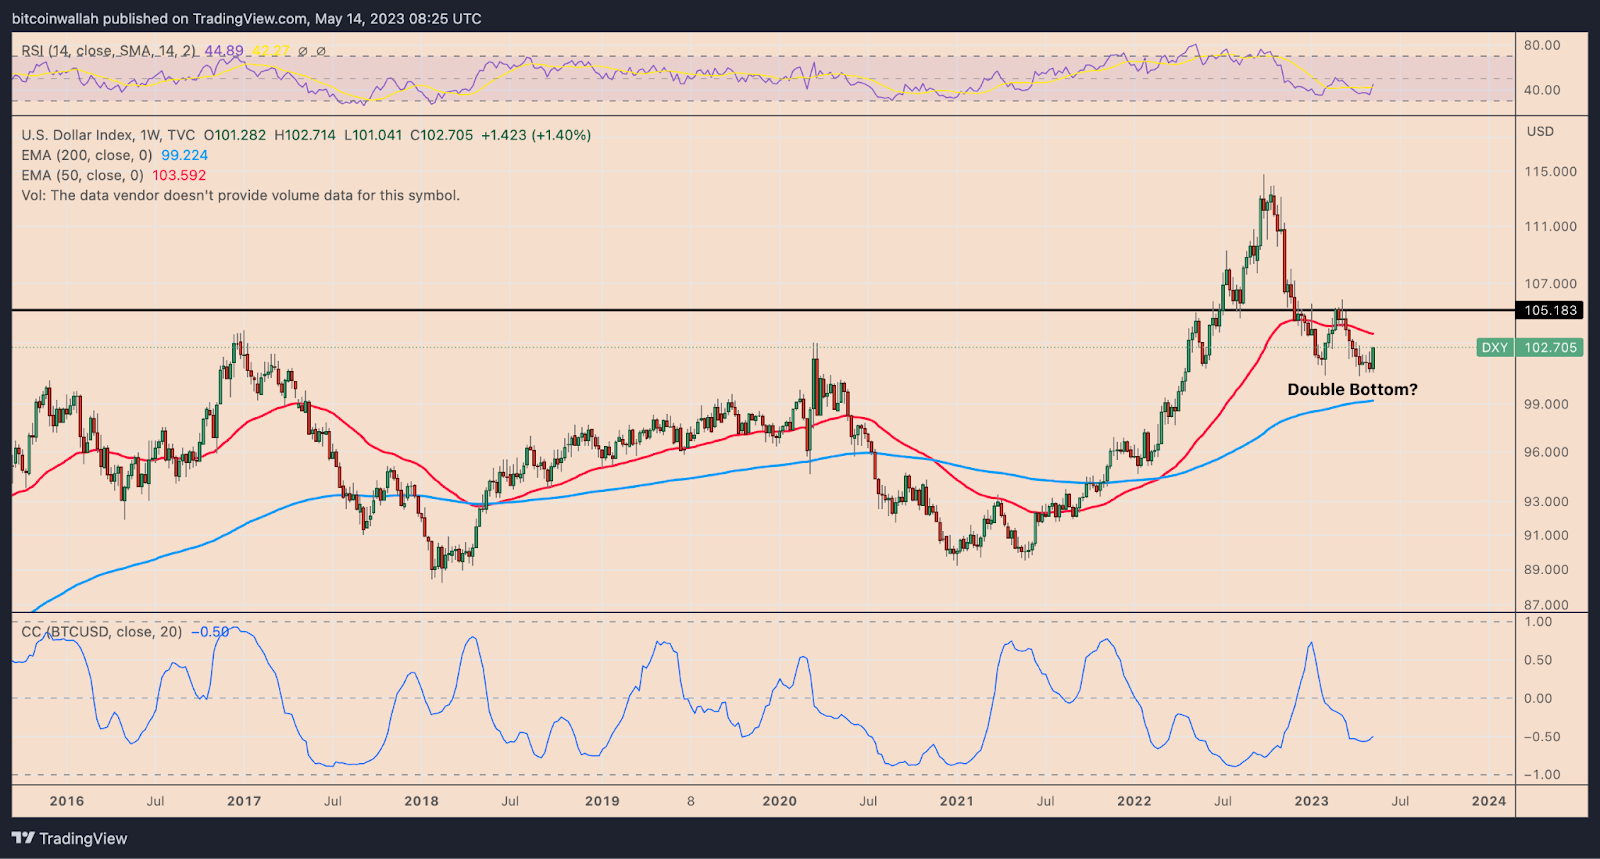
The U.S. Dollar Index (DXY) had its best week since September 2022, rising 1.4% to 102.70 against a basket of foreign currencies. The dollar’s rise confirmed a potential double-bottom pattern, which suggests a bullish reversal and a rise towards 105.85 in the next few months.
The weekly relative strength index (RSI) rebounded after reaching 35 and further hints at a bullish continuation. However, this is bad news for Bitcoin, as the strengthening negative correlation between DXY and Bitcoin, with a coefficient of around -50, indicates a downtrend in Bitcoin’s price.

The U.S. Consumer Price Index (CPI) report showed that headline inflation dropped to 4.9% in April, but core inflation increased to 5.5%, suggesting underlying price pressures remain sticky. The Fed rate cut expectations have cooled down for now, as a “pause” in interest rate hikes next month is virtually inevitable in futures and swaps markets, according to John Authers from Bloomberg.
A Fed pause should stabilise the bond market, which has historically been good for U.S. Treasuries but bad for stocks. If the Fed pauses at its peak rate for at least six months and the U.S. slides into recession, then history suggests 12-month returns following the final rate hike could be flat for 10-year U.S. Treasuries, while the S&P 500 could sell off sharply.
Gold Price Hits Key Reversal Point
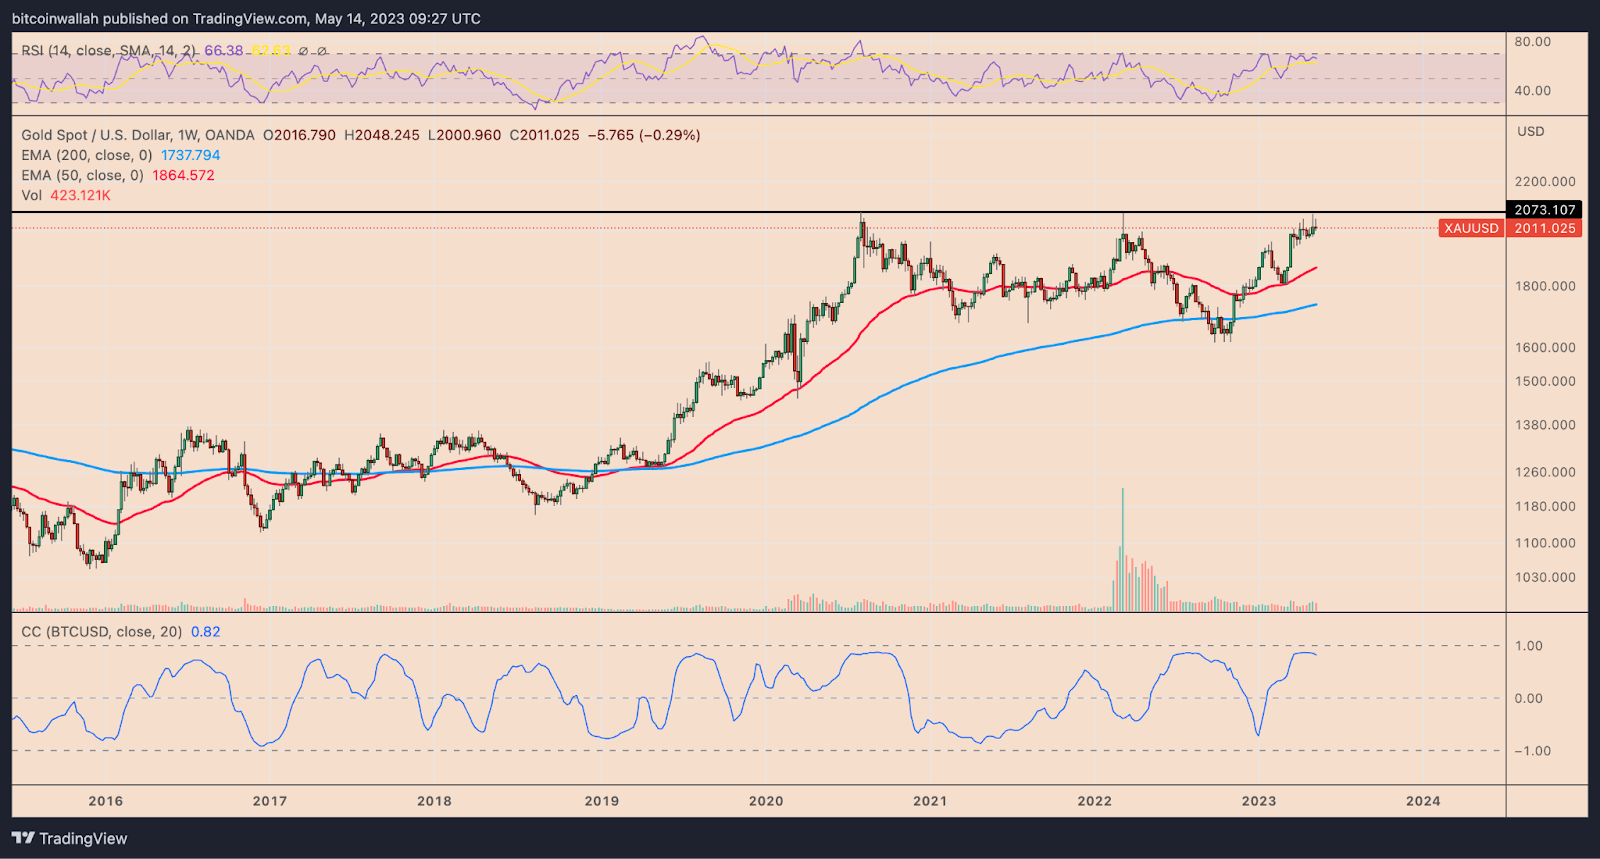
Amid the banking crisis, the price of gold has surged by almost 15%, reaching over $2,000 per ounce. Additionally, the relationship between gold and Bitcoin has grown stronger, with the weekly coefficient reading at 0.82 as of May 14.
However, gold has hit a horizontal resistance level of around $2,075, historically triggering bearish reversals. For instance, testing the same resistance level in August 2020 resulted in an 18% price decline, while in March 2022, gold prices fell by up to 22%.

If history repeats itself, and gold prices drop below this resistance level, the price could fall to its 50-week exponential moving average, at around $1,850. This scenario is supported by gold’s weekly RSI hovering around its overbought reading 70.
Since Bitcoin’s price positively correlates with gold, it may face a similar correction in Q2 if gold prices fall.
M2 Money Supply Falls
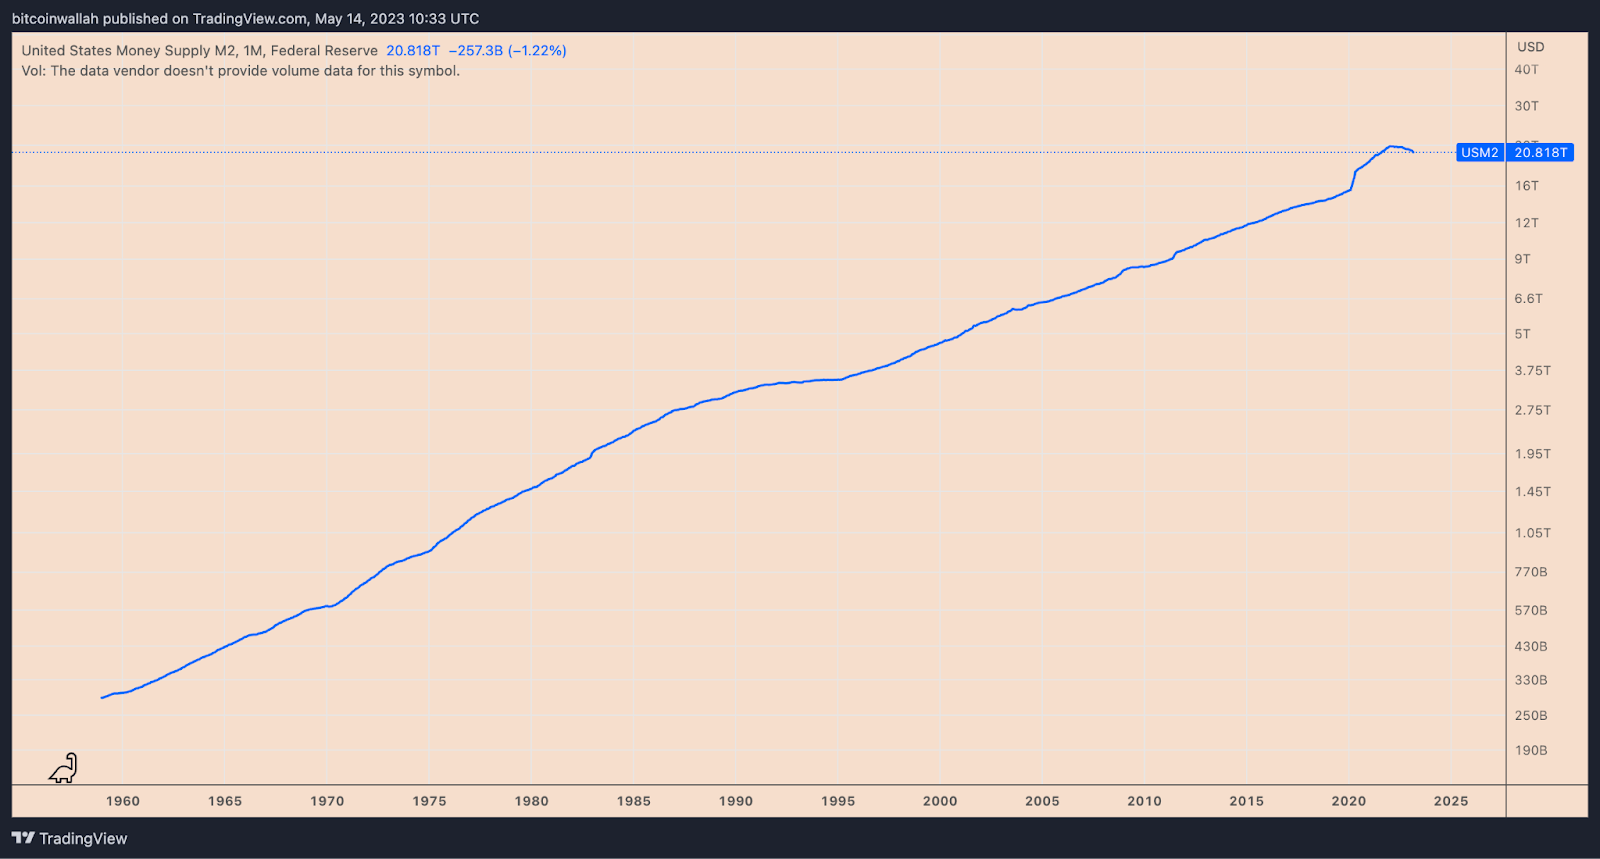
M2, which includes cash in circulation and dollars in the bank and money-market accounts, experienced a surge of more than 40% during the Covid-19 pandemic due to the Fed’s quantitative easing, peaking at $21.84 trillion in January 2022. As of May 2023, it has fallen to $20.81 trillion, a decline of over 4% from its peak.

Historically, a drop of 2% or more in M2 supply has occurred four times and has preceded three depressions and one panic. This is a cause for concern for the stock market since Bitcoin often moves parallel with U.S. stock indexes. A significant decrease in M2 could indicate that new lows are on the horizon for Bitcoin.
The correlation coefficient between Bitcoin and the Nasdaq-100 index every week stands at 0.92.
BTC Price “Rising Wedge”
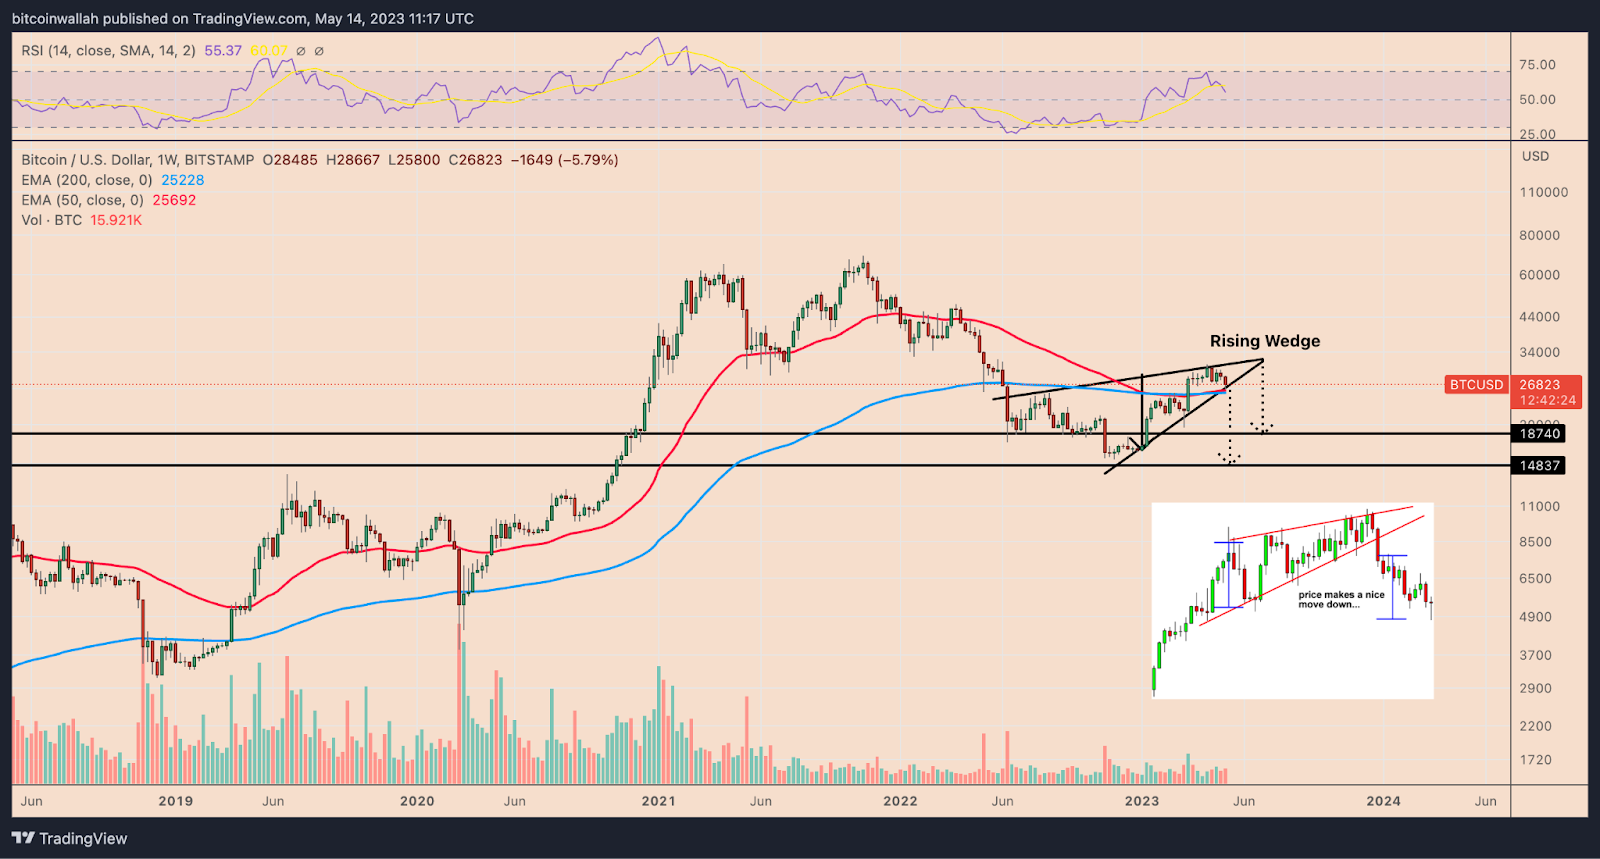
Depending on where the breakdown point occurs in what looks like a rising wedge pattern, Bitcoin’s price may head toward the $15,000-$20,000 range. According to technical analysts, a rising wedge is a bearish reversal pattern that occurs when the price increases inside a range defined by two contracting, ascending trendlines.

It is resolved when the price falls below the lower trendline, dropping by as much as the maximum wedge height. If this pattern is confirmed, taking into account the macro indicators mentioned earlier, Bitcoin’s price could drop to as low as $15,000 in 2023, a decrease of about 45% from current levels.
 coinculture.com
