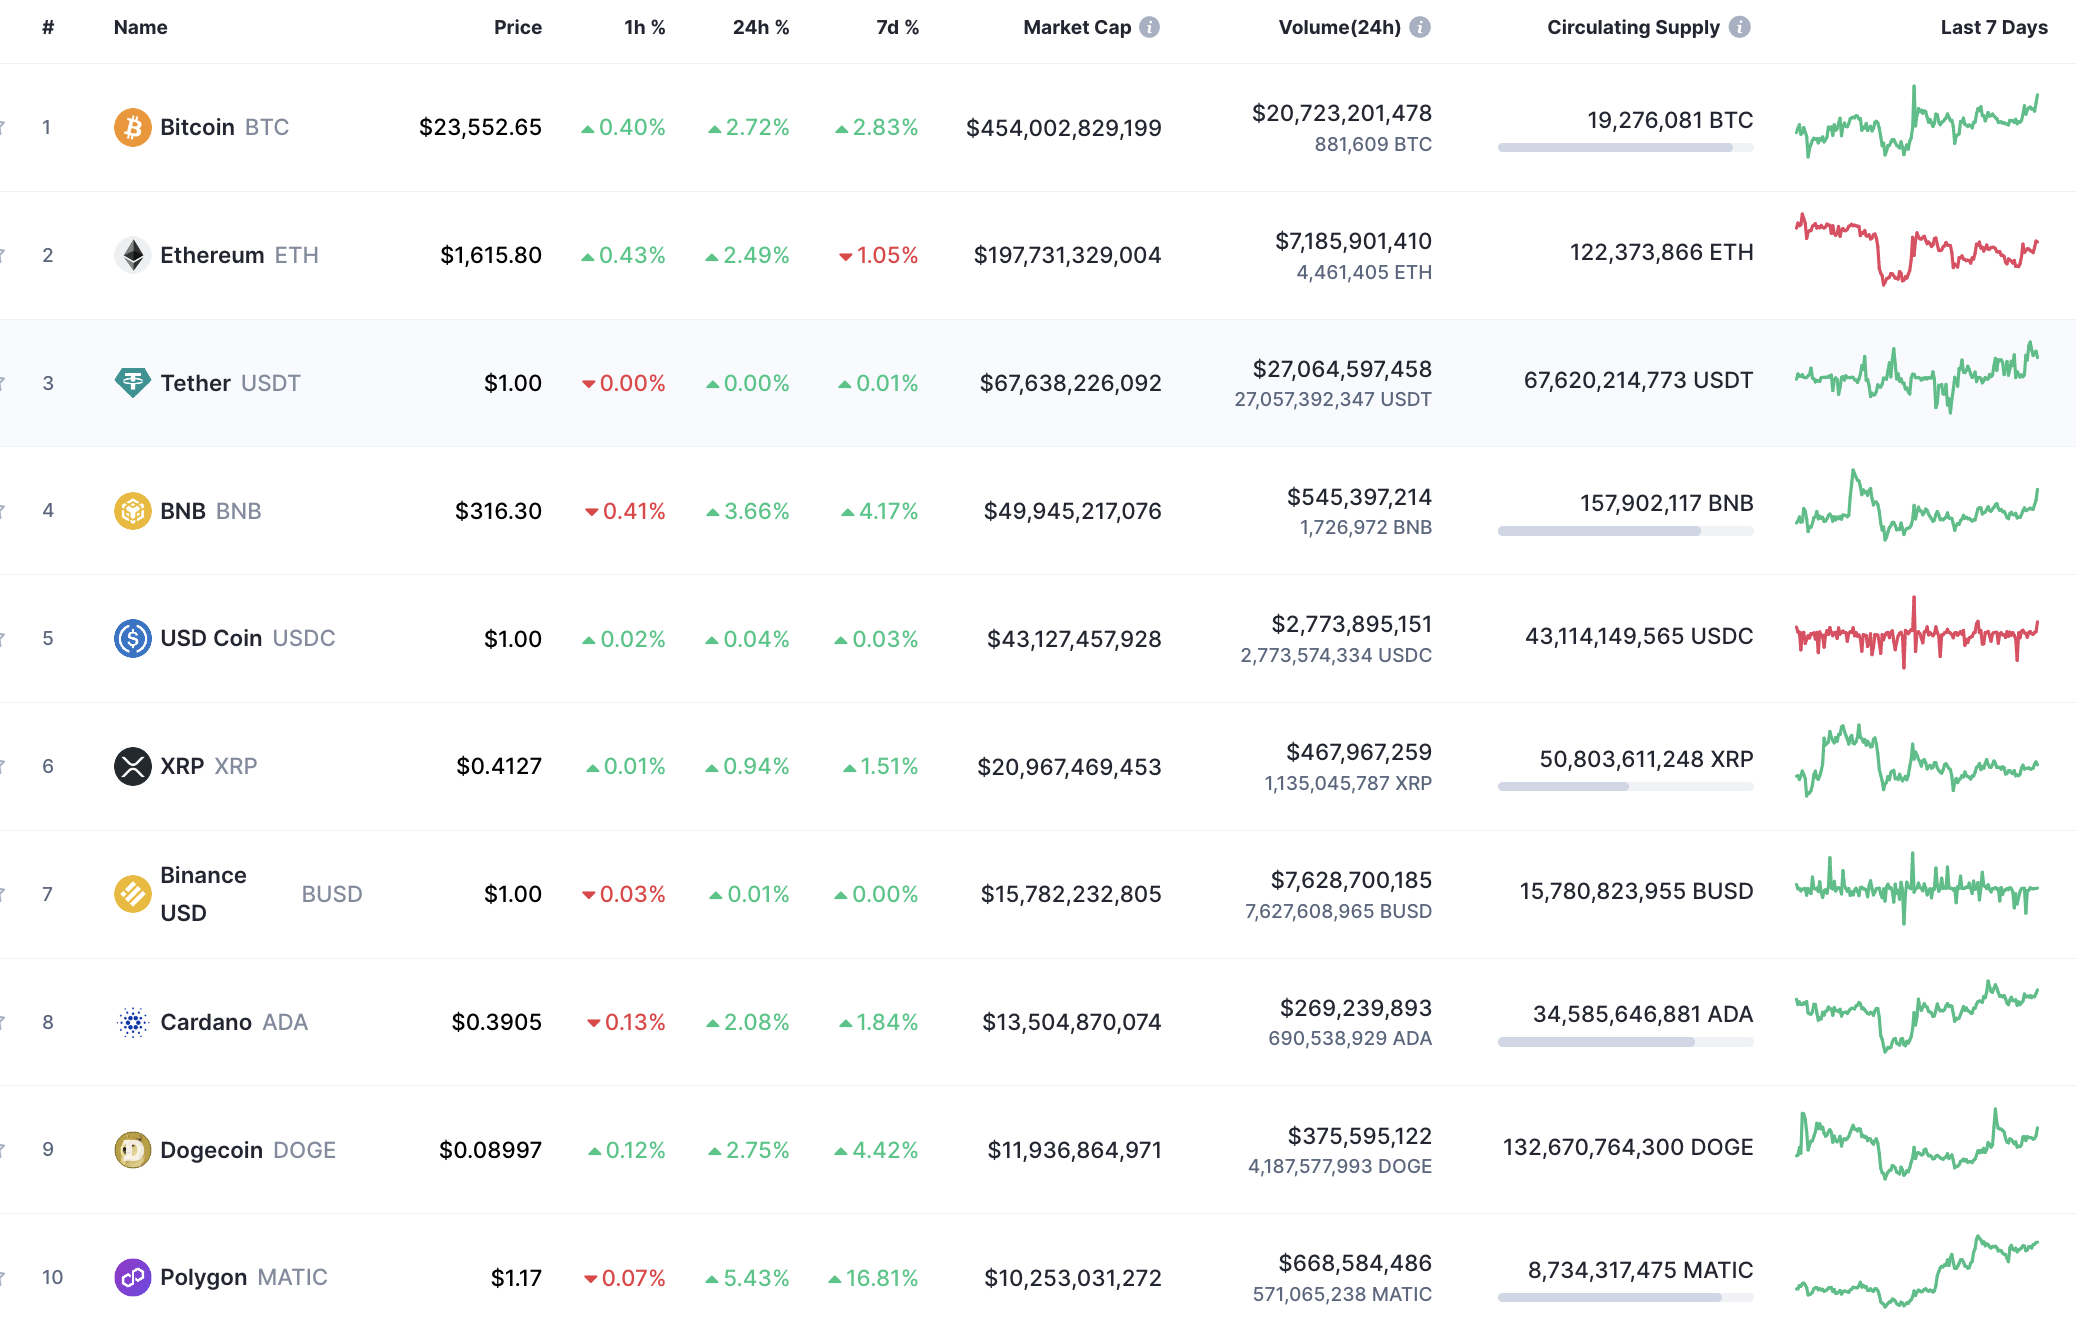
The market keeps rising on the last day of the week as most of the coins are in the green zone.
BTC/USD
The rate of Bitcoin (BTC) has gone up by 2.72% over the last 24 hours.
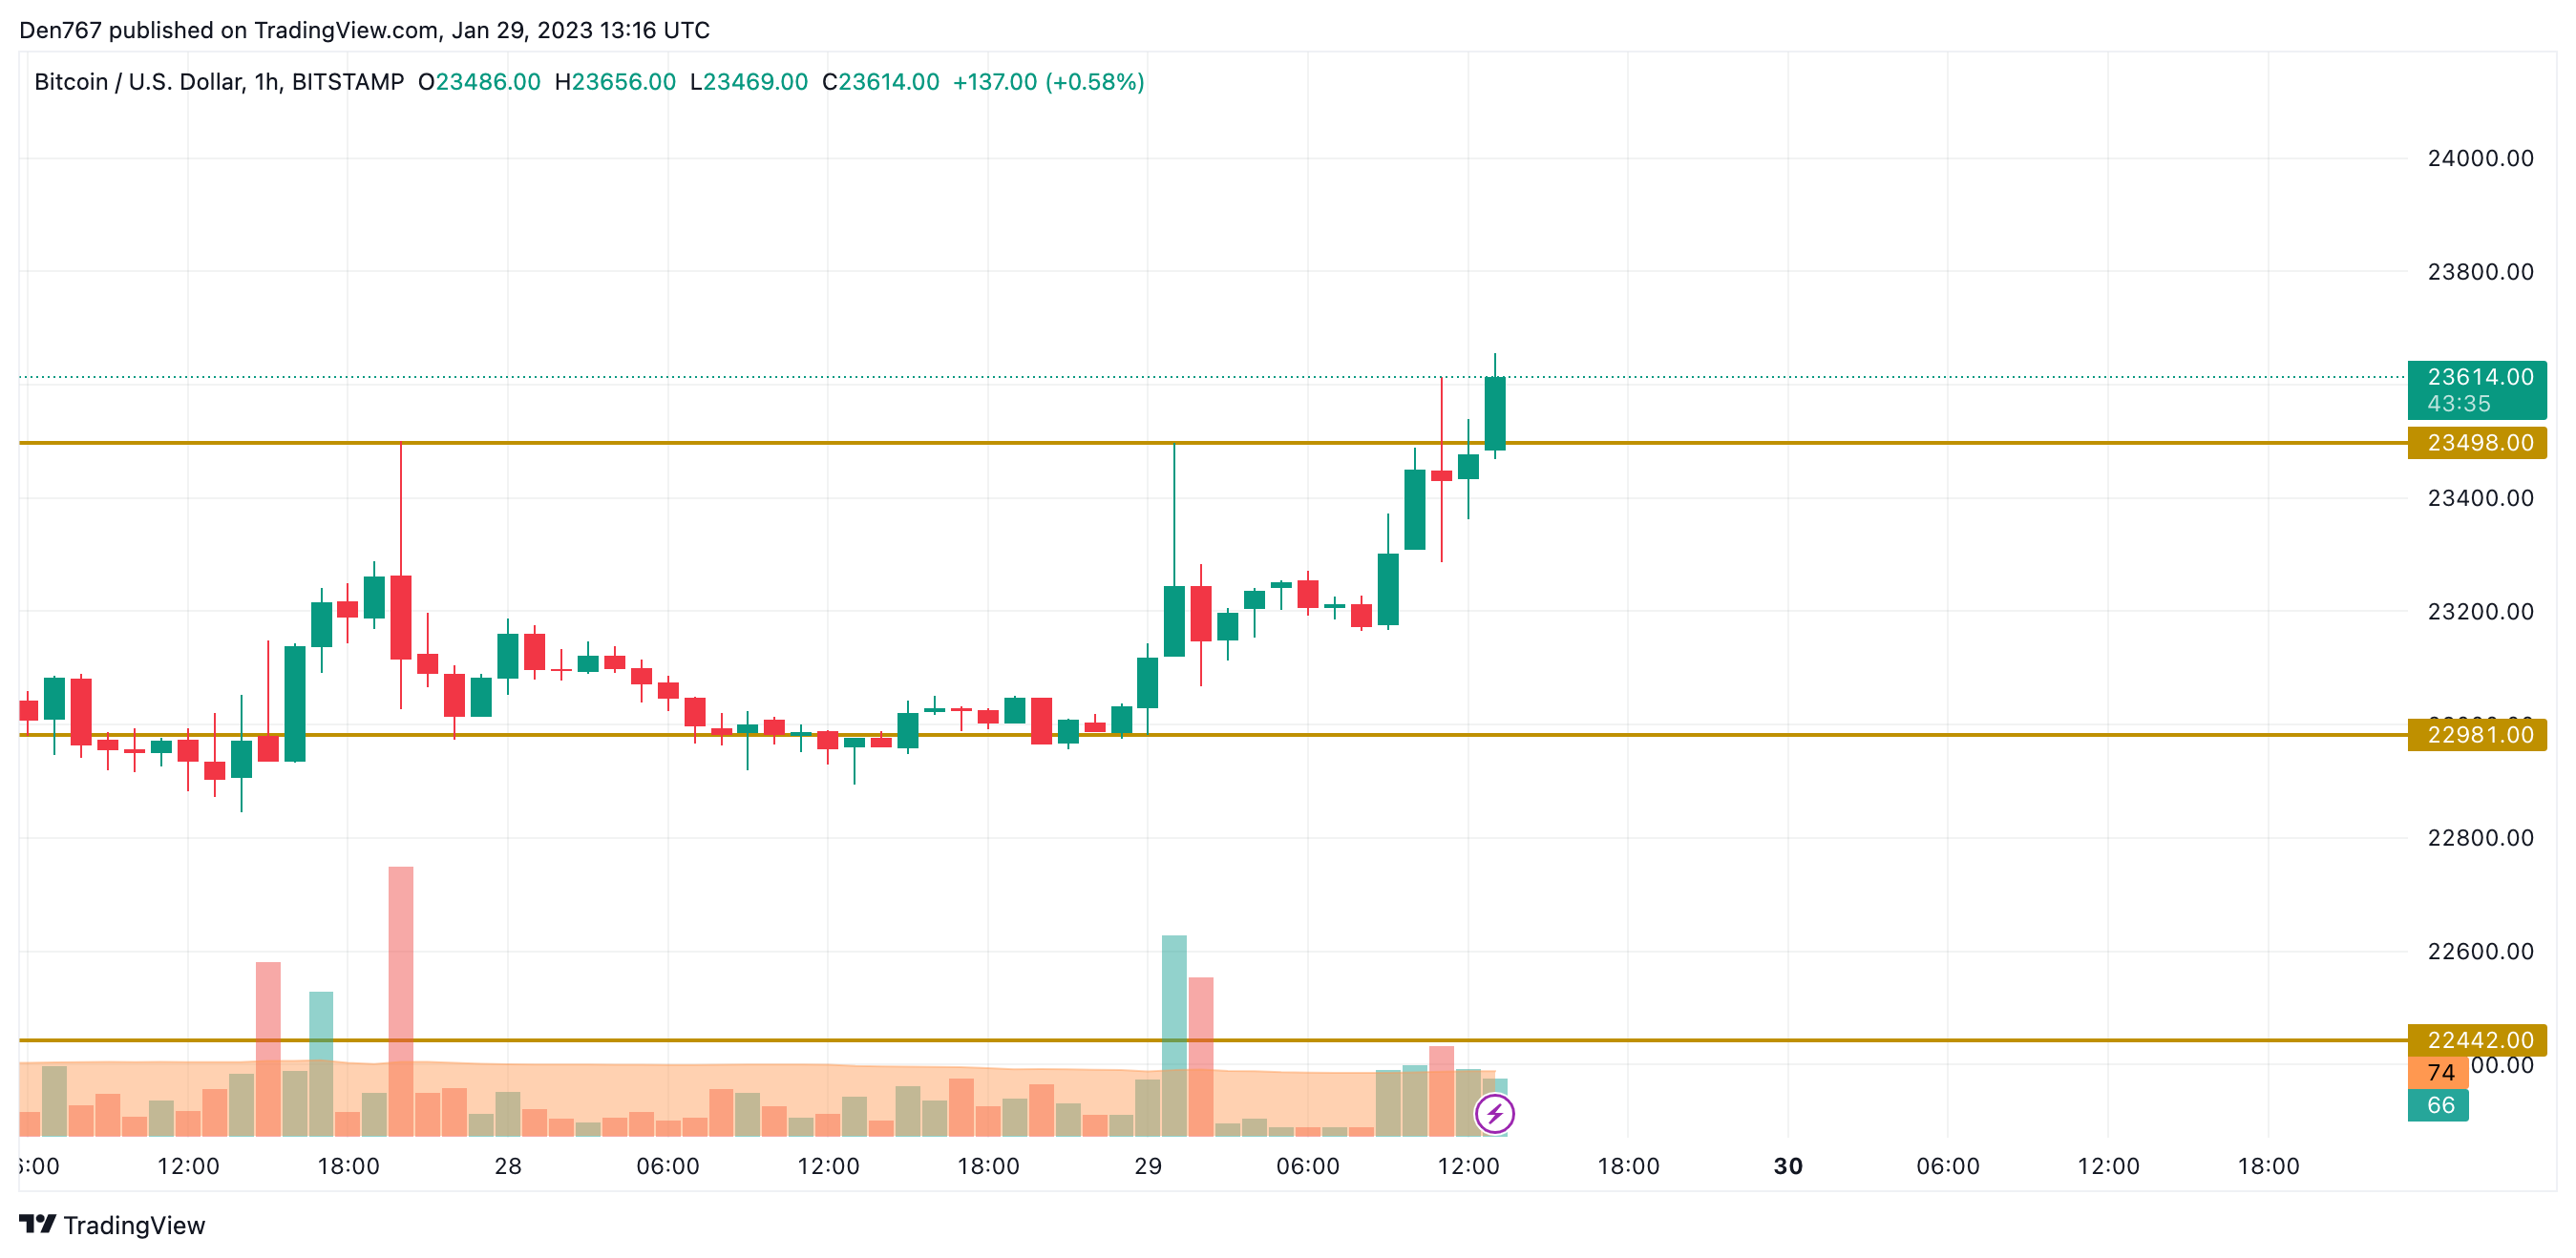
On the hourly chart, the price has broken the resistance level of $23,498. If bulls can hold the rate above that mark until the end of the day, the impulse may continue to the $24,000 zone tomorrow.
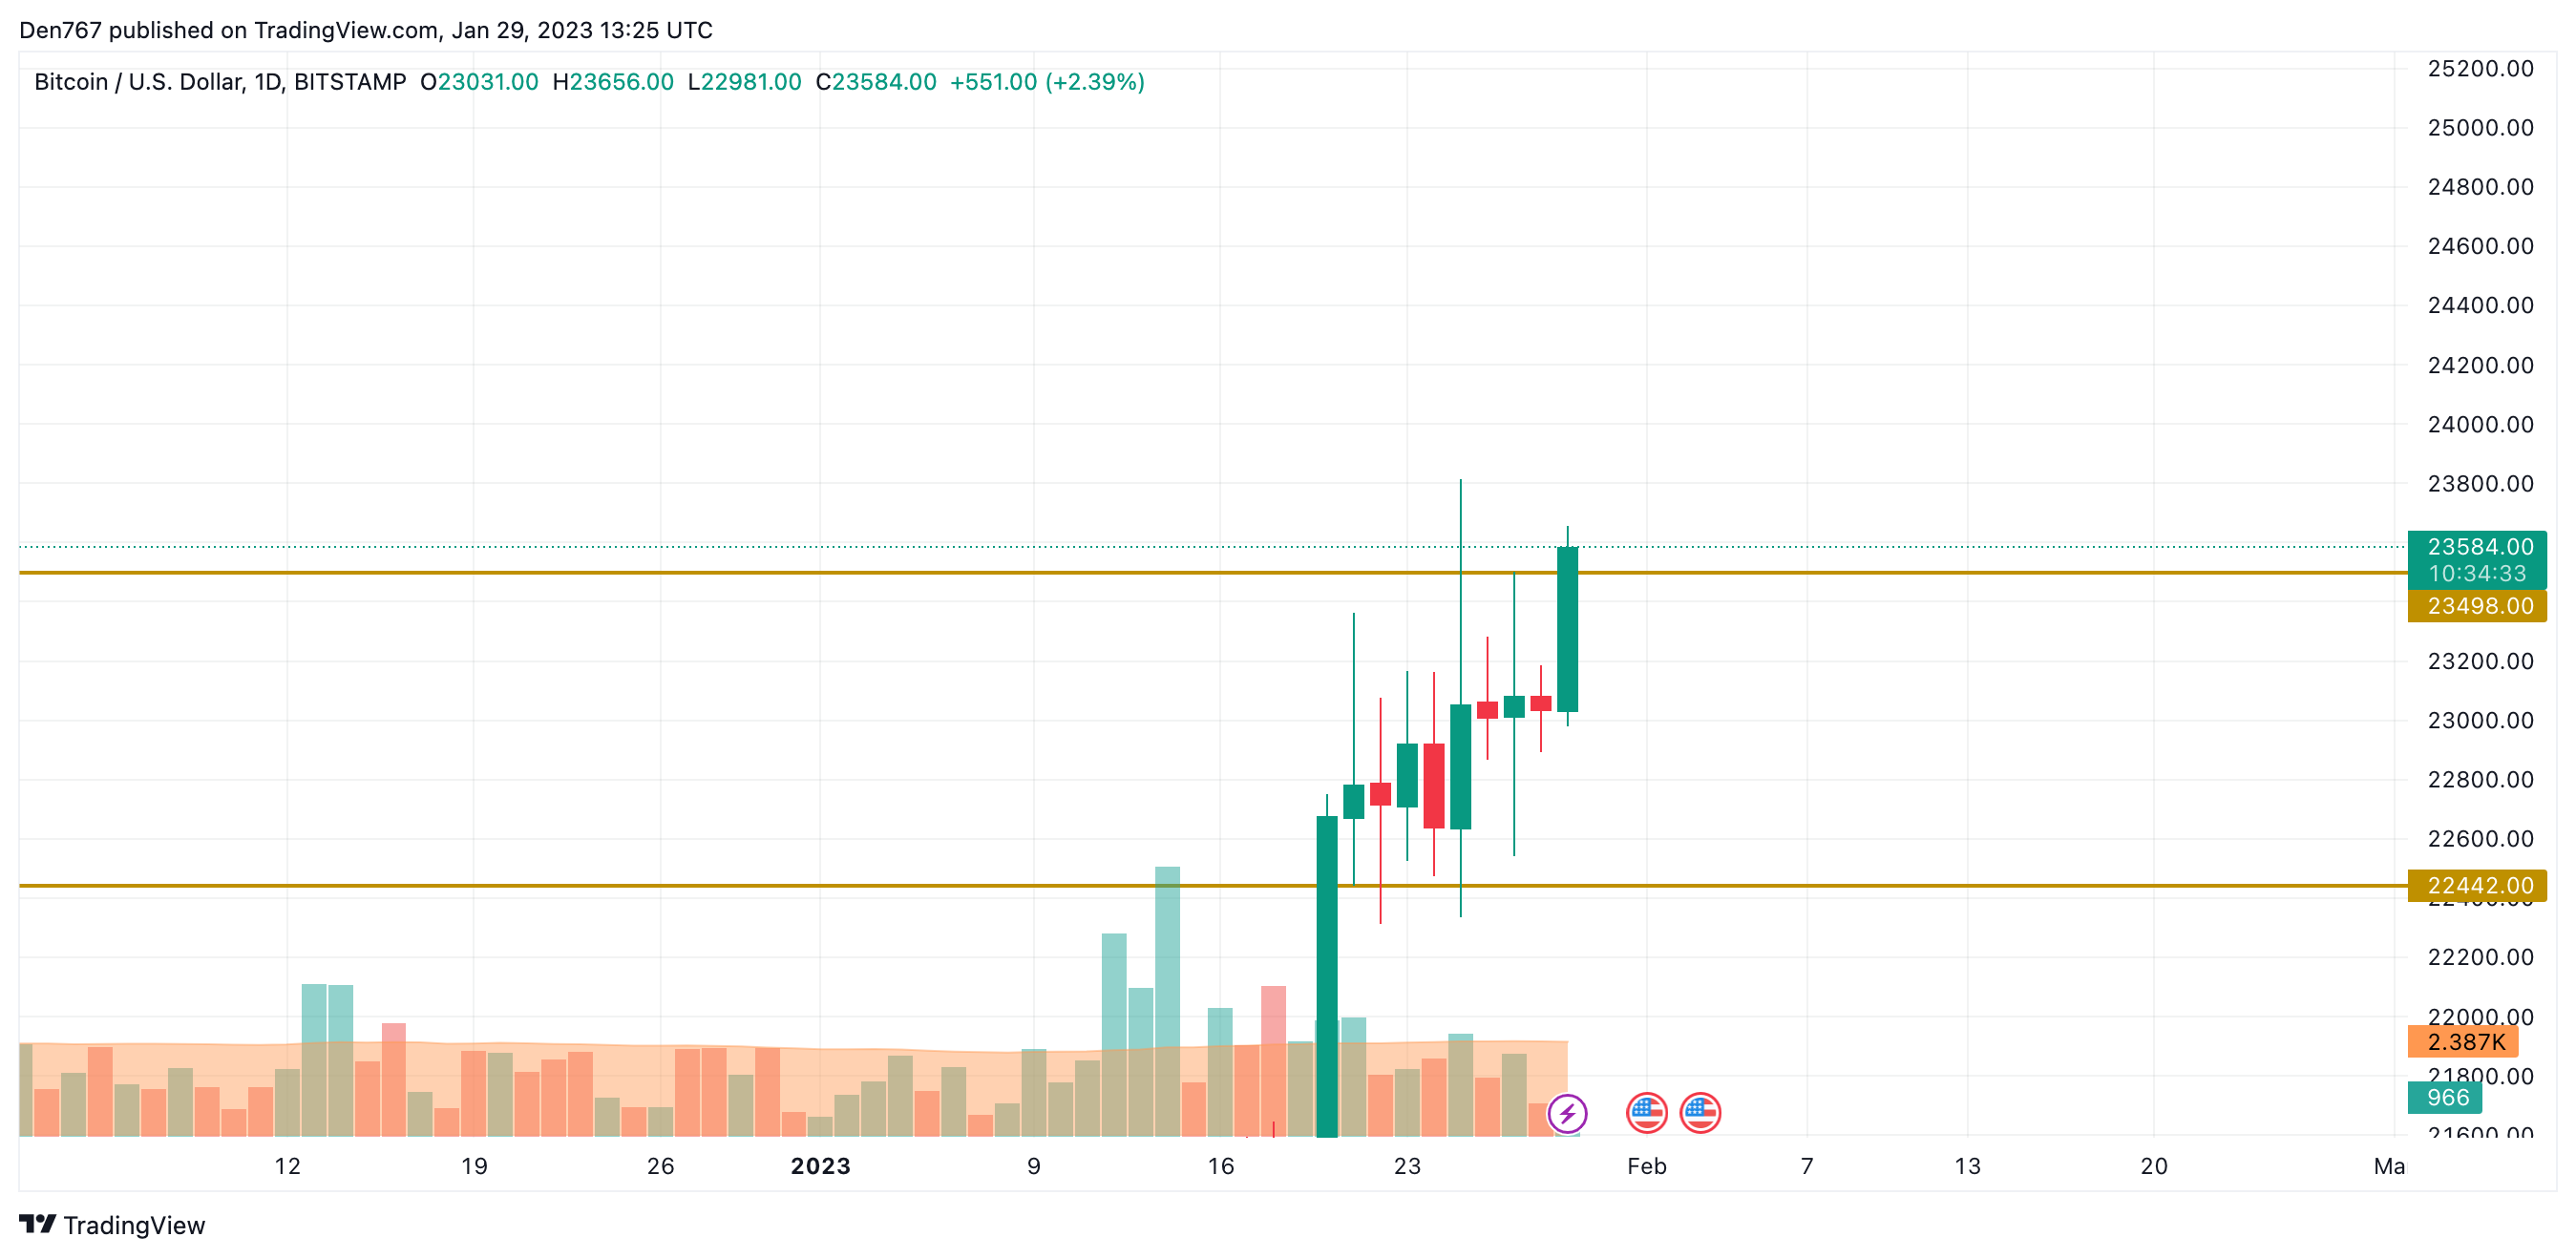
On the bigger time frame, the price is about to fix above the same resistance at $23,500. The volume is low, which means that sellers are not powerful enough to seize the initiative. If the candle fixes above the aforementioned mark, the accumulated energy might be enough for a move to the $25,000 zone.
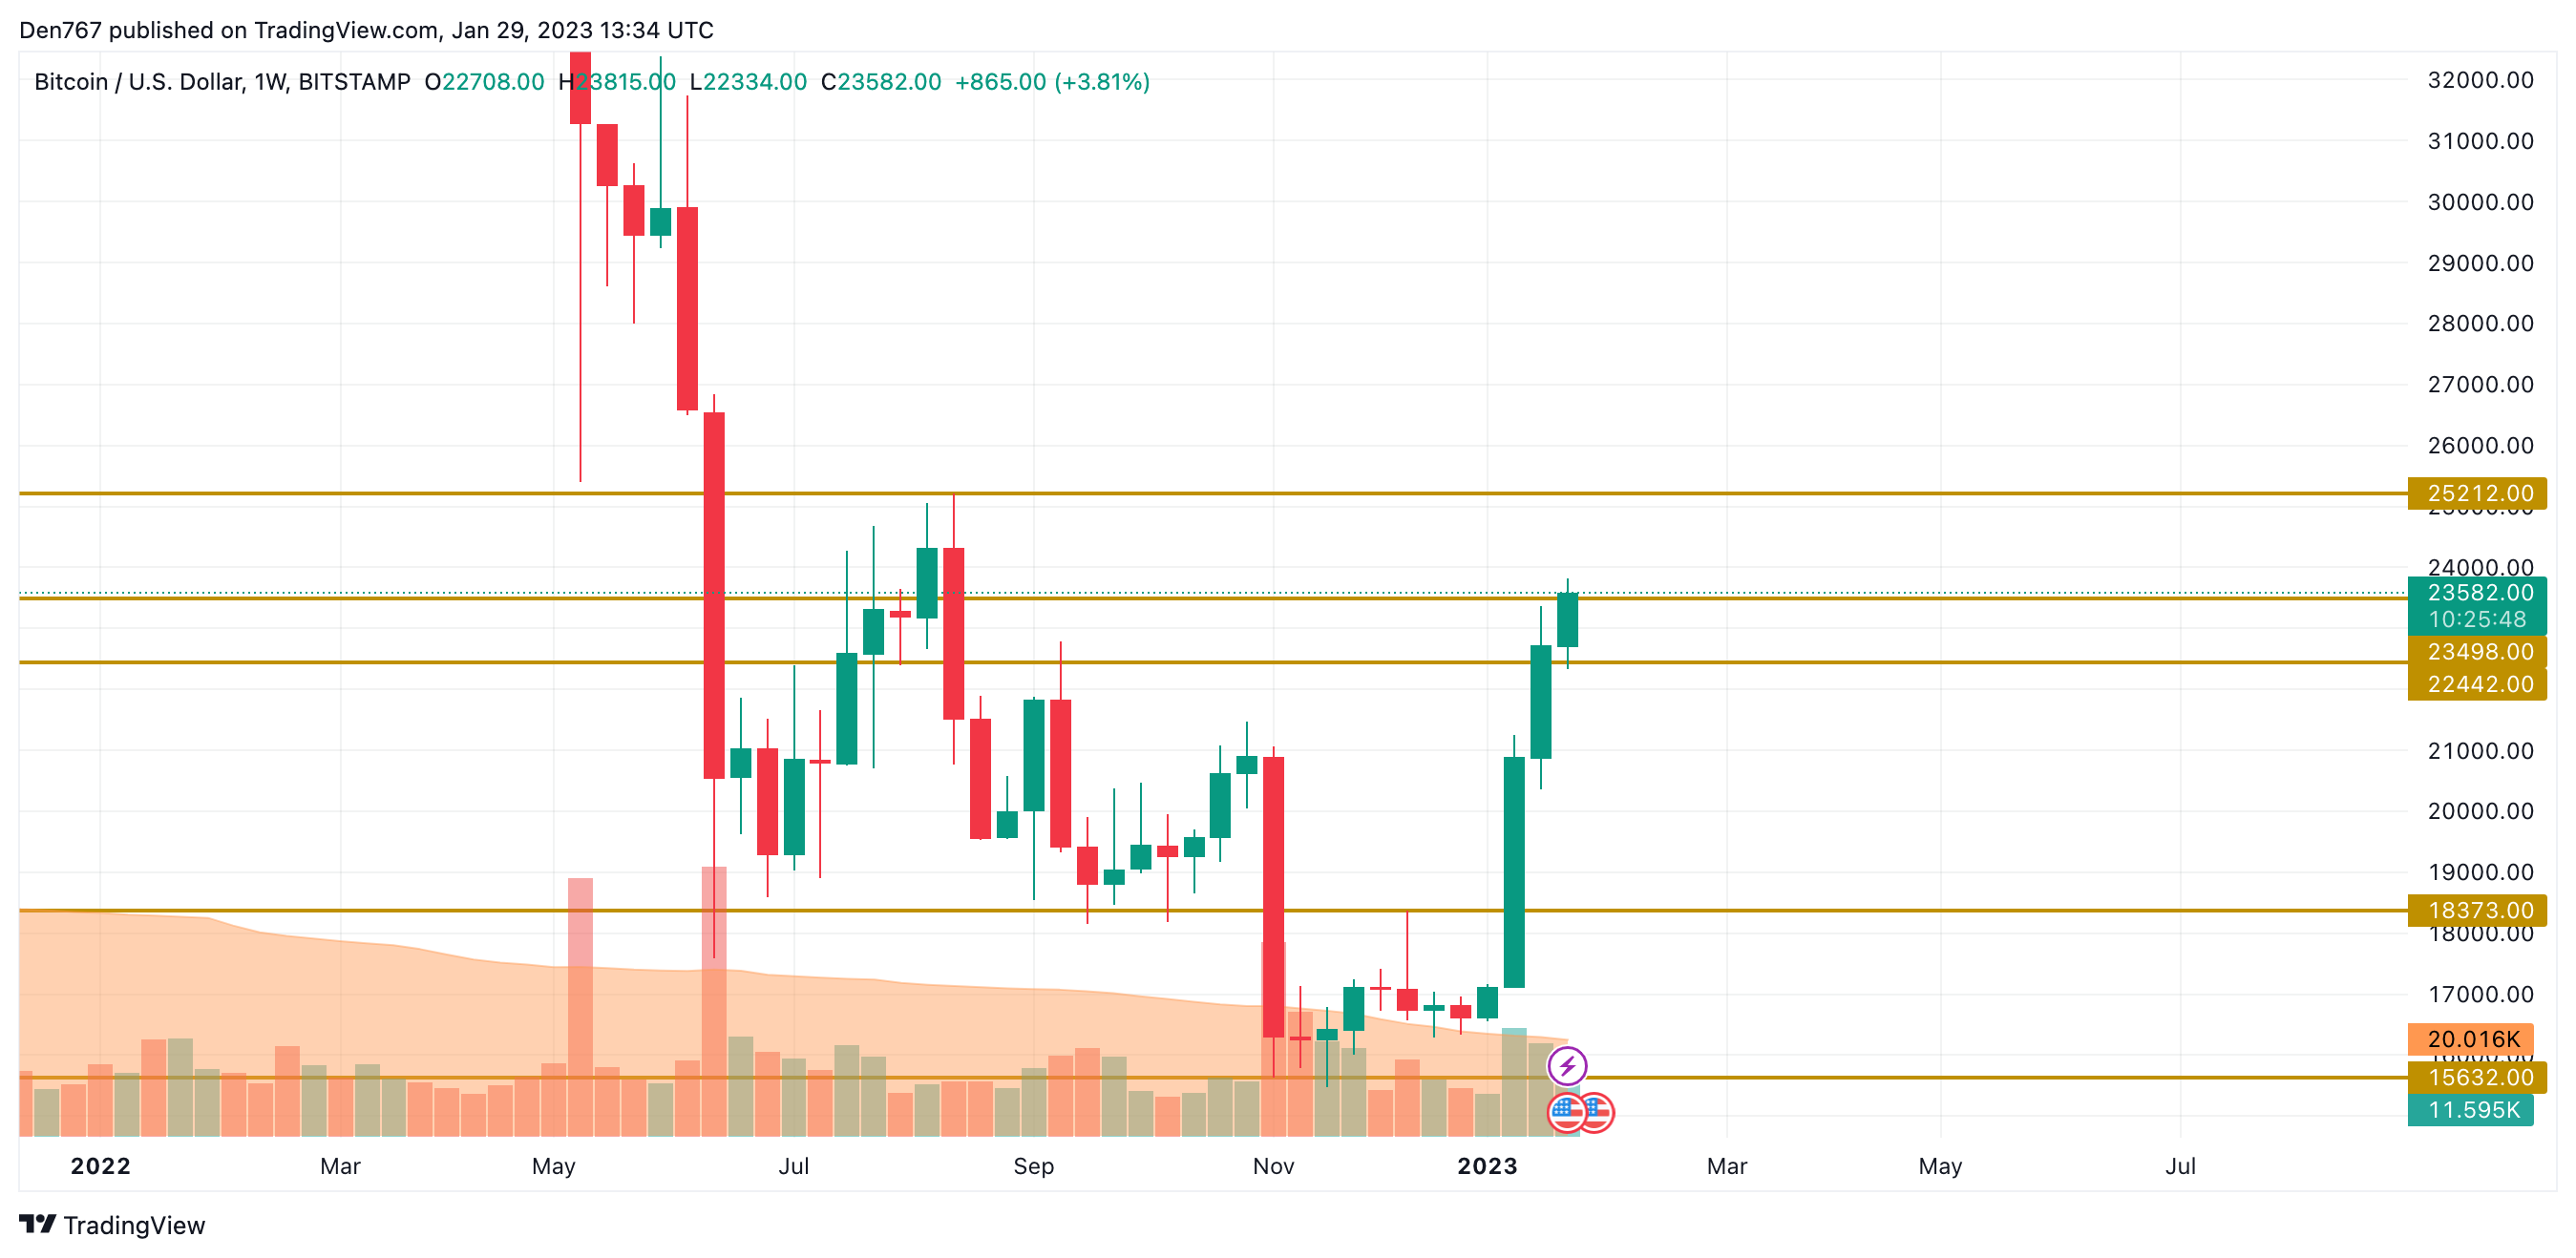
A bullish situation is also on the weekly chart as the bar is about to close with no long wicks, which means that there is a high chance to see a continued rise. If that happens, the growth may lead to a test of the nearest resistance at $25,512.
Bitcoin is trading at $23,585 at press time.