In this article, BeInCrypto takes a look at on-chain indicators, more specifically the Network Value to Transaction (NVT) ratio. This is done to try and determine if the current price movement for bitcoin ($BTC) is supported by the change in transaction volume.
NVT reached an all-time high in July and has been falling since, even though the $BTC price has increased. This is a sign of legitimate market growth.
What is NVT?
The NVT (Network Value to Transaction) is an indicator that shows the relation between market capitalization and transaction volume. It’s created by simply dividing the network value with the daily transaction volume.
A high NVT is considered a bearish reading. It means that the rate of increase for the value of the network is overtaking that of transaction volume. This is often unsustainable and can be a sign of market bubbles. On the other hand, a decreasing NVT value means that the network is undervalued relative to its level of transactions. A sideways reading supports the current trend.
For a more detailed explanation, click here.
$BTC reading
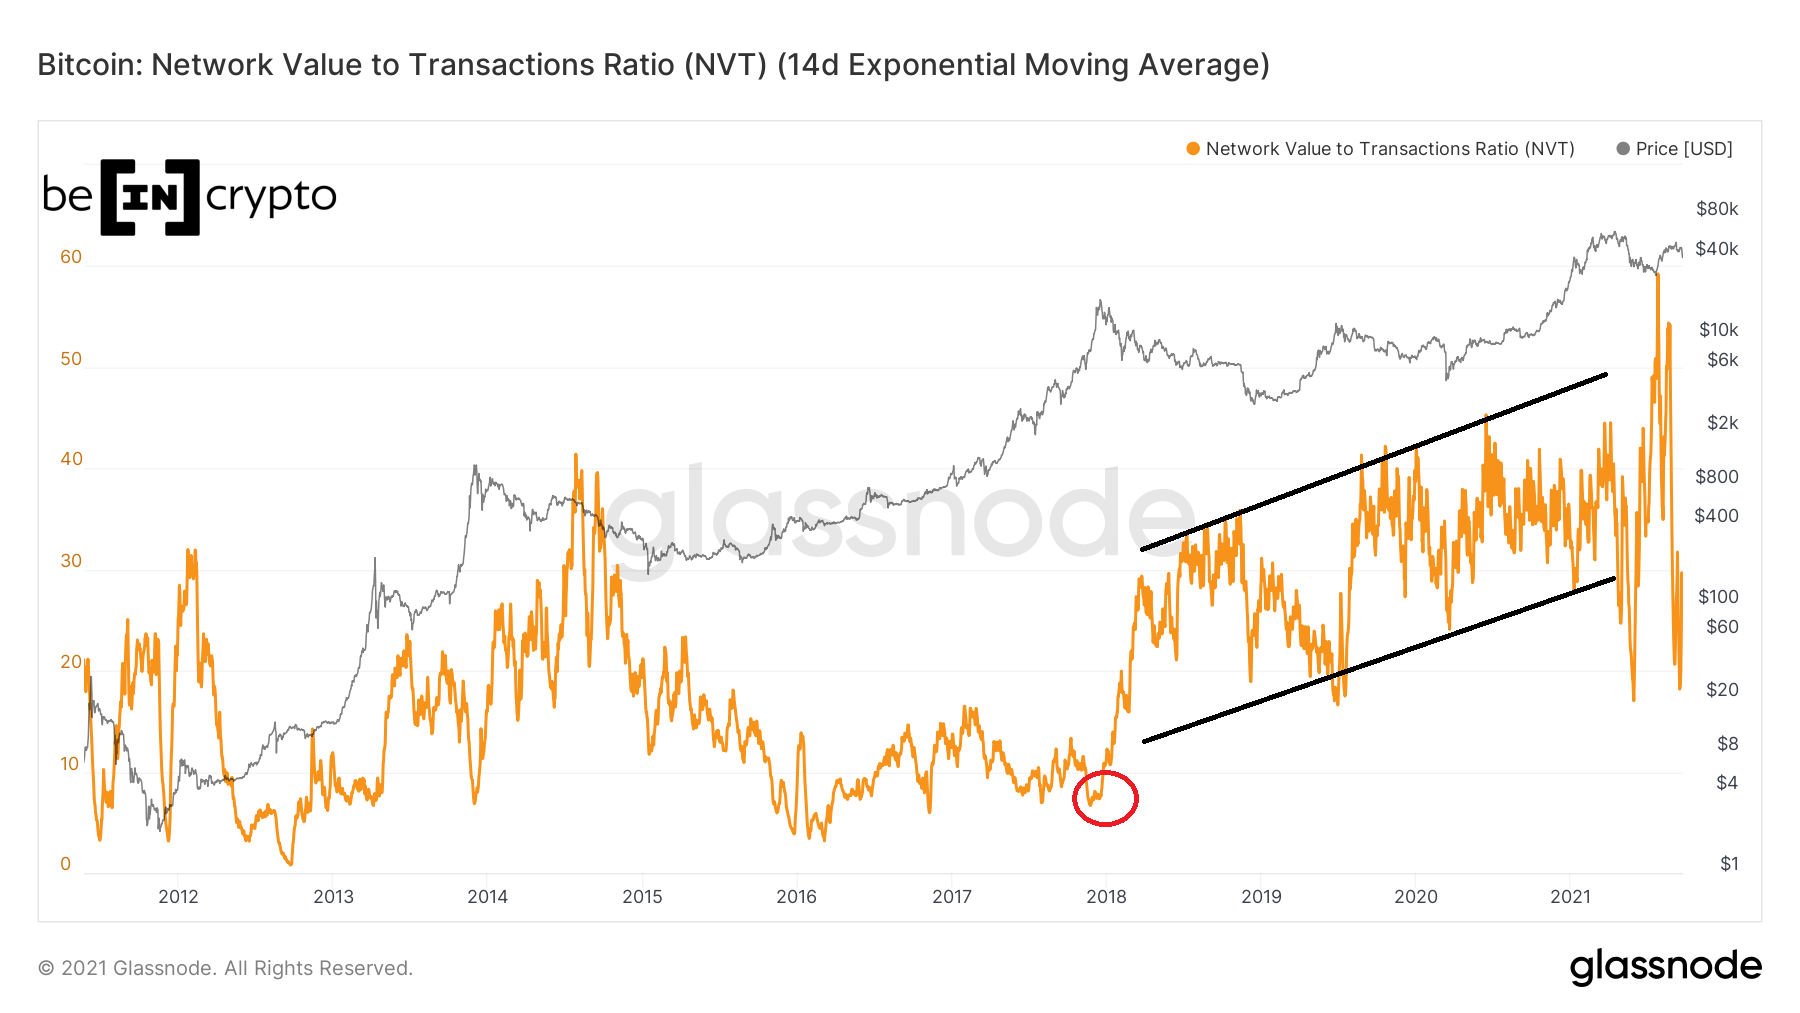
NVT has been on a steady uptrend since the 2017 top (red circle). In the period between March 2018 and the April 2021 all-time high, it consolidated in a range between 17 and 31 (black channel).
Prior to the 2017 top, it hovered between 4 and 15. Therefore, the sustained increase in the indicator reading alongside the increased price is a sign of legitimate network growth.
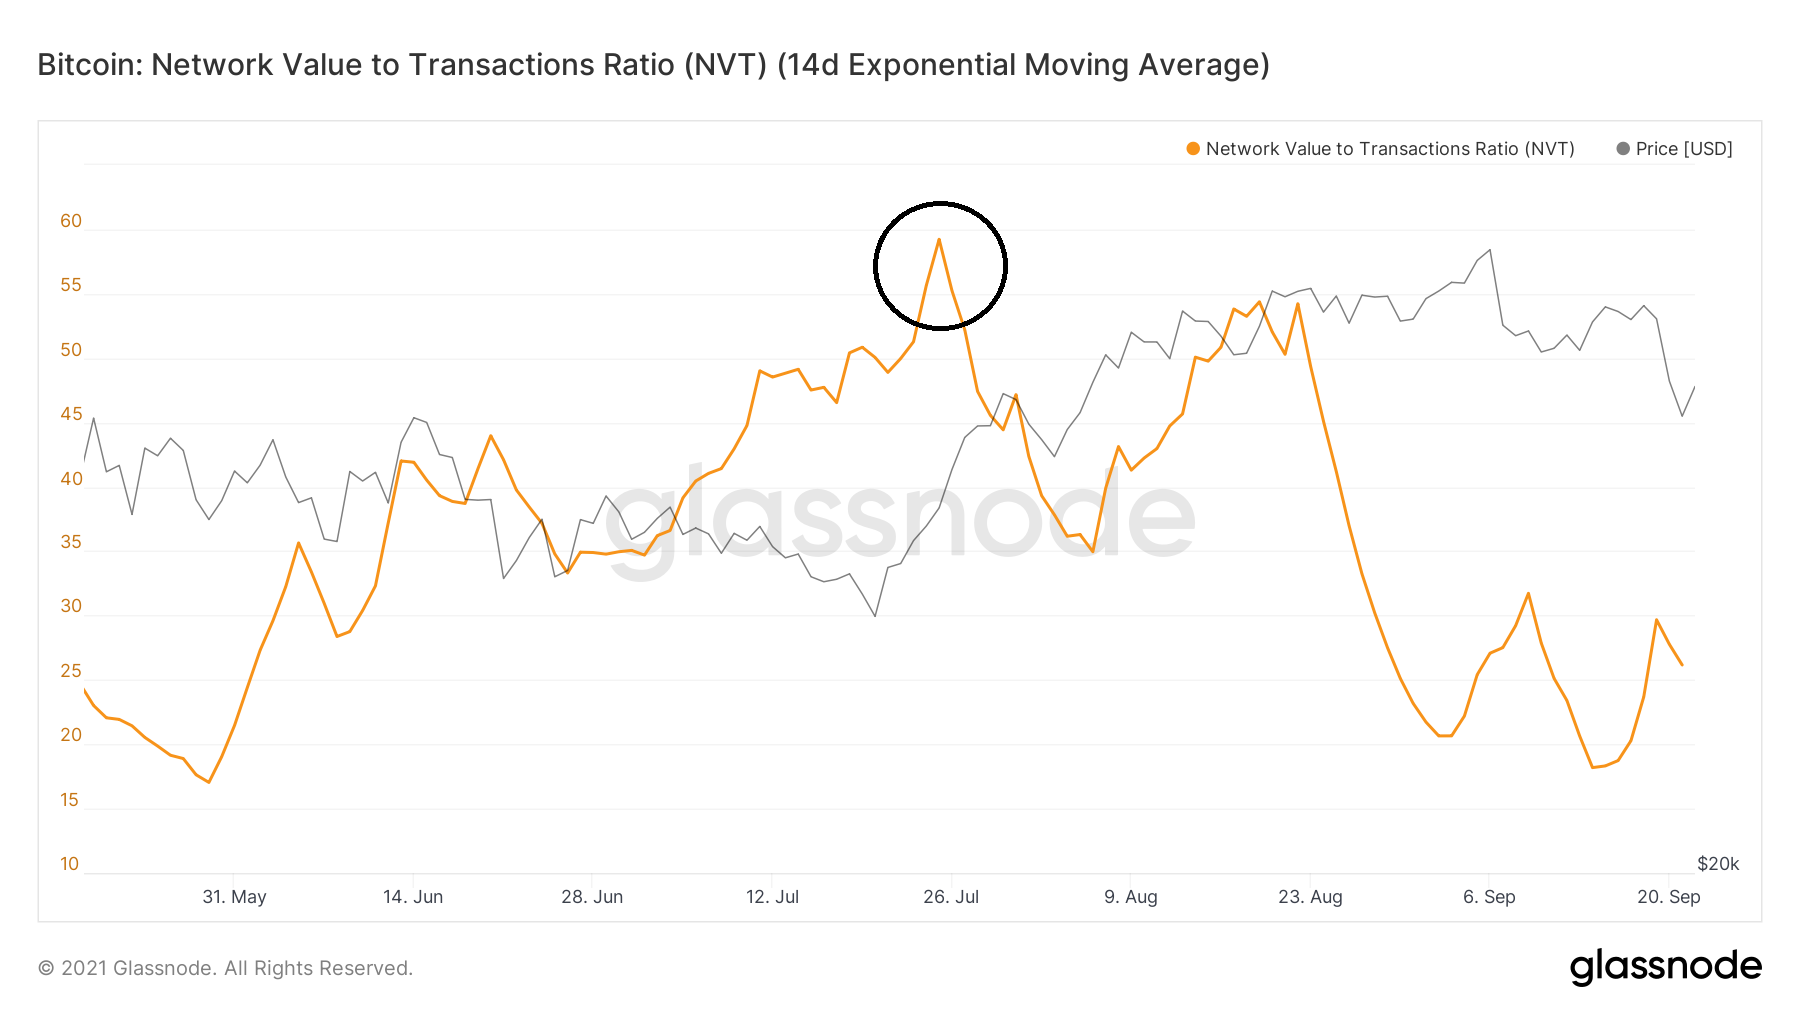
The indicator reached an all-time high of 59.22 on July 25 (black circle). At the time, the $BTC price was $35,420. Therefore, the high NVT reading means the number of transactions was very low since the reading was much lower than during the all-time high $BTC price.
However, NVT has been falling since then and is currently at 29, back at its previous three-year range. This is likely the result of transactions picking up, since the $BTC price is considerably higher than it was on July 25.
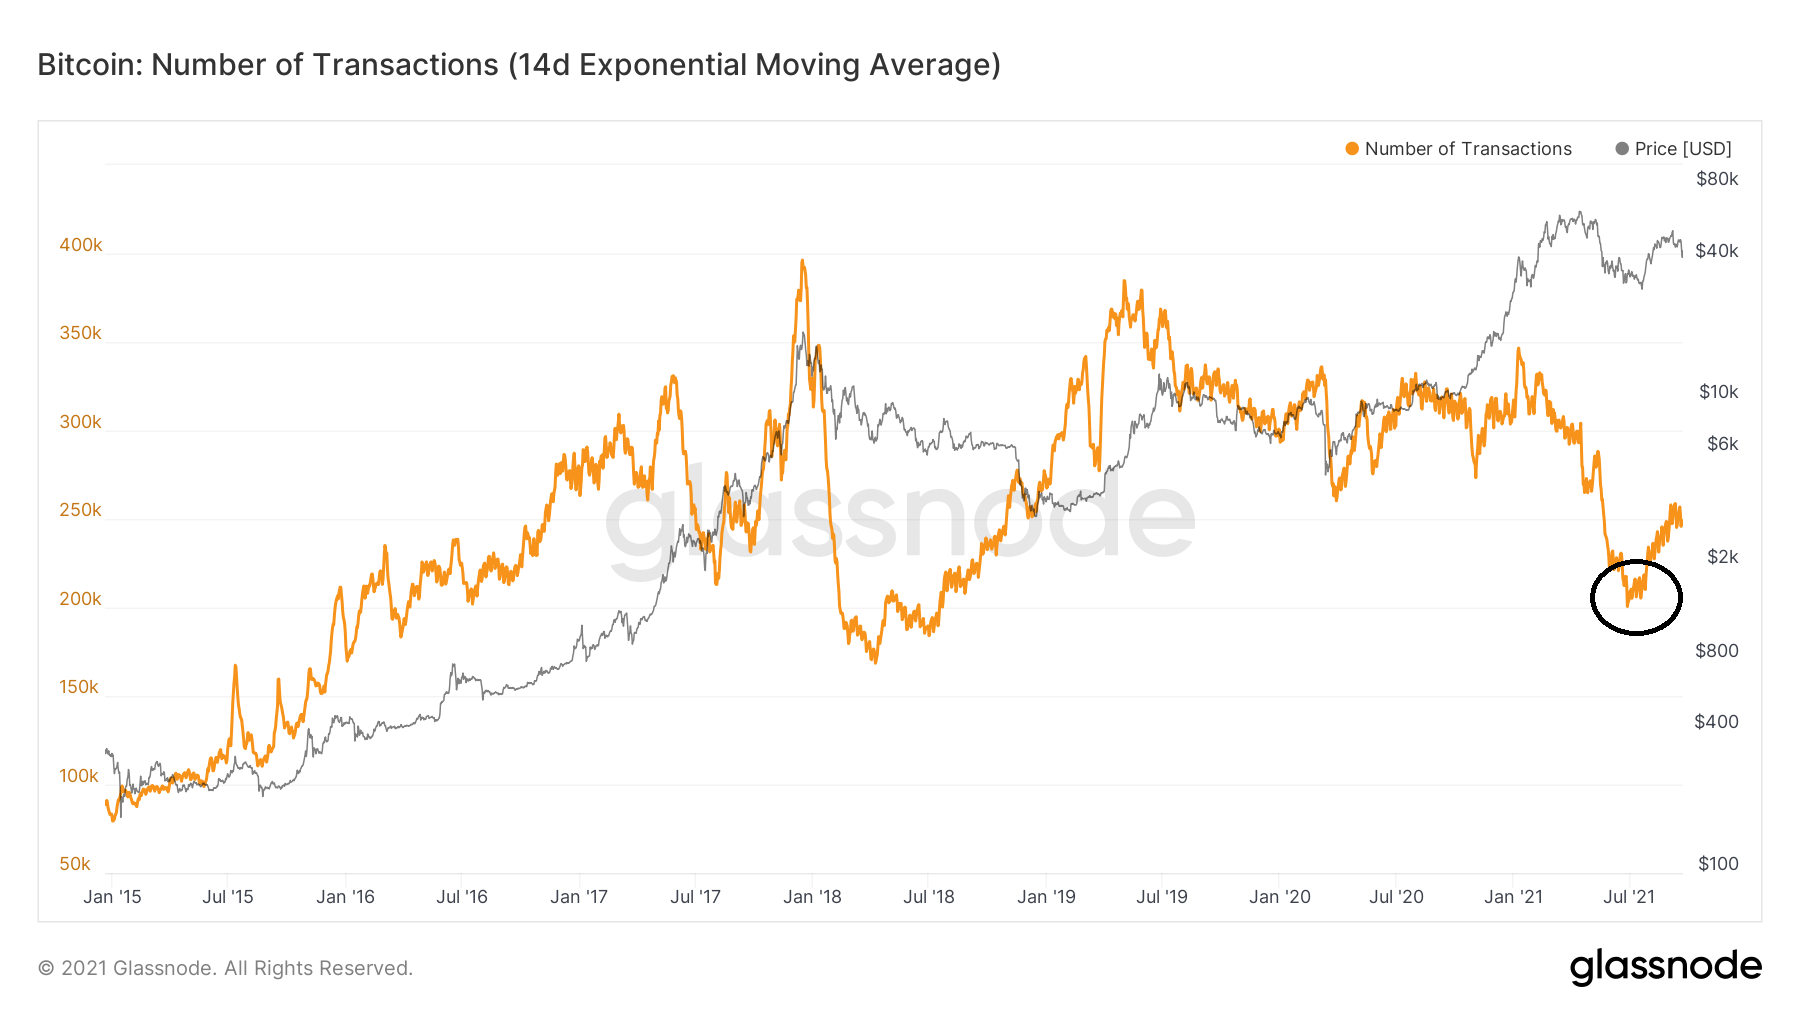
This is confirmed when looking at the number of $BTC transactions, which have increased greatly since the July bottom (black circle).
Therefore, the current price increase is supported by an increase in the number of $BTC transactions.