On May 29, cryptocurrency investors were in for a surprise after EOS overtook Litecoin’s position on the cryptocurrency charts. Bitcoin [BTC], however, continued to consolidate its gains and retained its 57% dominance over the coin market.
1-Day BTC chart
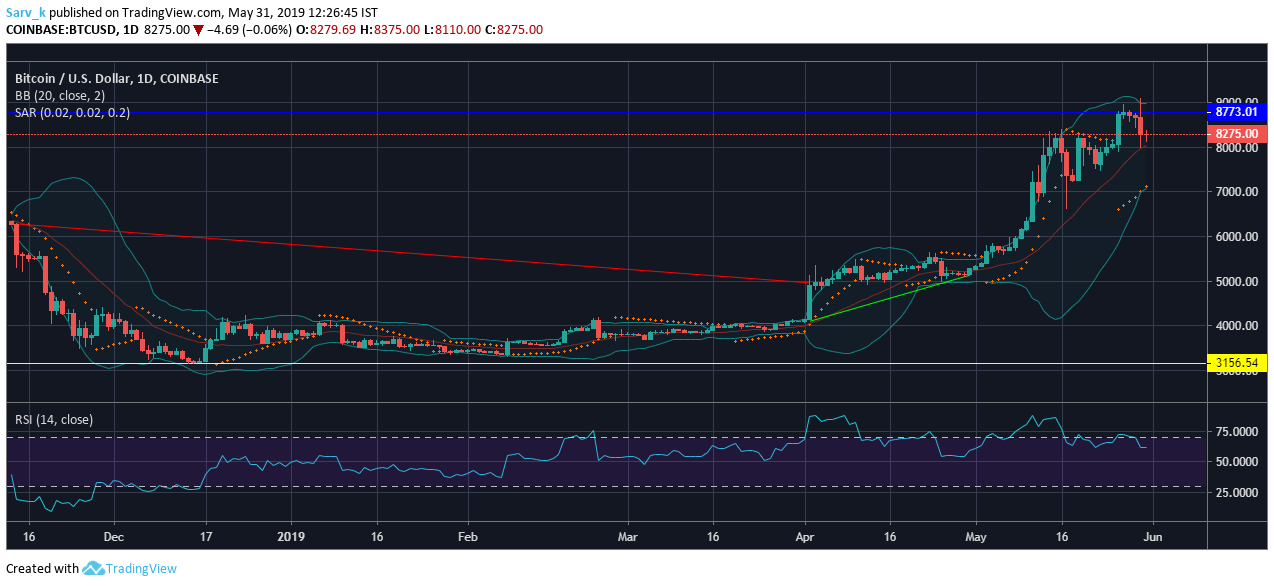
Source: TradingView
BTC’s 24-hour trading volume was $28 billion, while its market cap was recorded to be $147 billion. It was priced at $8,275, at press time.
An uptrend was seen from $4,098.98 to $5,130.91, and a downtrend was seen from $6,278.88 to $4,959.41. Resistance was at $8,773.01 and the support was at $3,156.54.
Bollinger Bands indicated expanding volatility in the market.
Parabolic SAR pointed towards a bullish market as the dotted markers were seen below the candles.
Relative Strength Index was sighted above the 50-line, indicating a relatively bullish market, at press time.
1-Day LTC chart
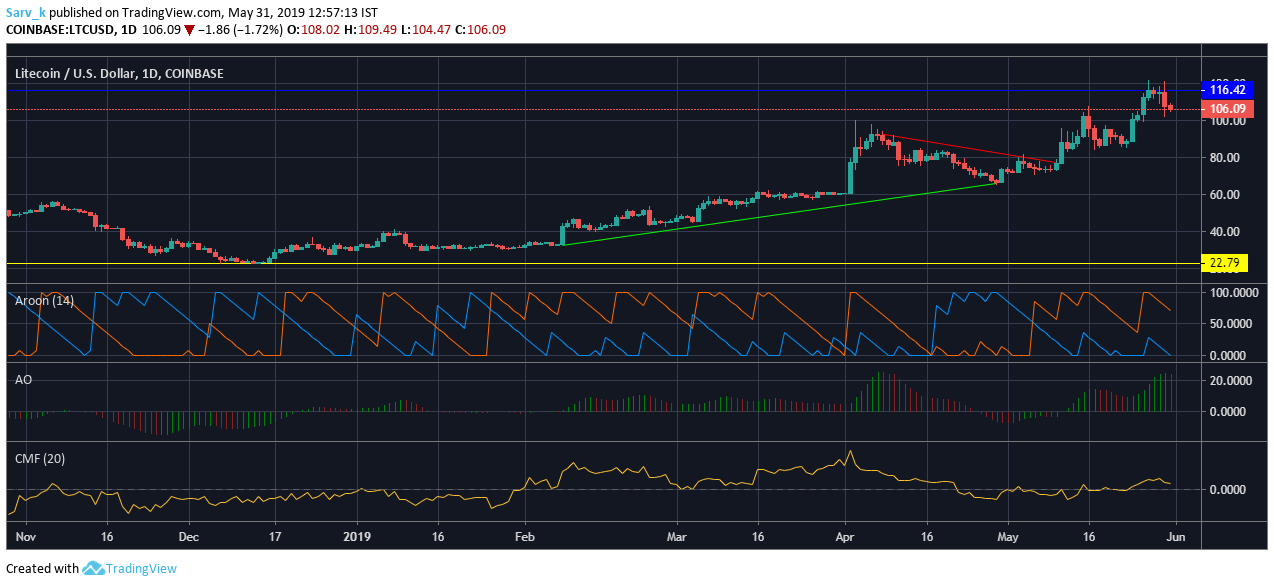
Source: TradingView
Litecoin’s [LTC] 24-hour trading volume was seen at $4.96 billion, with a market cap of $6.61 billion. The coin was priced at $106.25, at press time.
The uptrend was from $32.45 to $66.03, while the resistance was at $116.42 and the support was at $22.79.
The Aroon indicators suggested a sideways moving trend, as the Aroon up-line and Aroon down-line were seen moving down.
Awesome Oscillator signified market momentum in the LTC market. However, some bearish signals were evident as the momentum was falling.
Chaikin Money Flow indicated a money inflow into the LTC market as the indicator was above the zero-line, at press time.
Conclusion
Despite a bloodbath in the cryptocurrency market today, Litecoin and Bitcoin remained largely bullish over the long-term.