After briefly trading above $9k, Bitcoin dropped back to support at $8200. Is BTC now heading for $6k, or is this dump just another bear trap?
Highlights:
- Still above 3 hour trend
- Another possible bear trap
- Lower time frame RSI analysis
Taking a look at the 3 hour chart we can see that Bitcoin is still above its upwards price trend and currently close to support. This gives us some confidence that Bitcoin is still bullish and that it will return to upwards movement as soon as this dump runs out of steam. Any further movement down could bring us closer to $8000, which is our main support at the moment on this larger trend.
On RSI we can see that momentum has also been forming a trend, although currently RSI is sitting outside of that trend. From our previous Bitcoin analysis we were able to spot a few bear traps on the hourly chart, and from the looks of it we just got our first bear trap on the 3 hours chart. As we know when RSI is generally above 50, it's an indication of bullishness. Since it fell below the trend so quickly and failed to penetrate the 30 RSI, it shows us that current price is out of the norm and that we can expect it to recover as soon as momentum returns to trend.
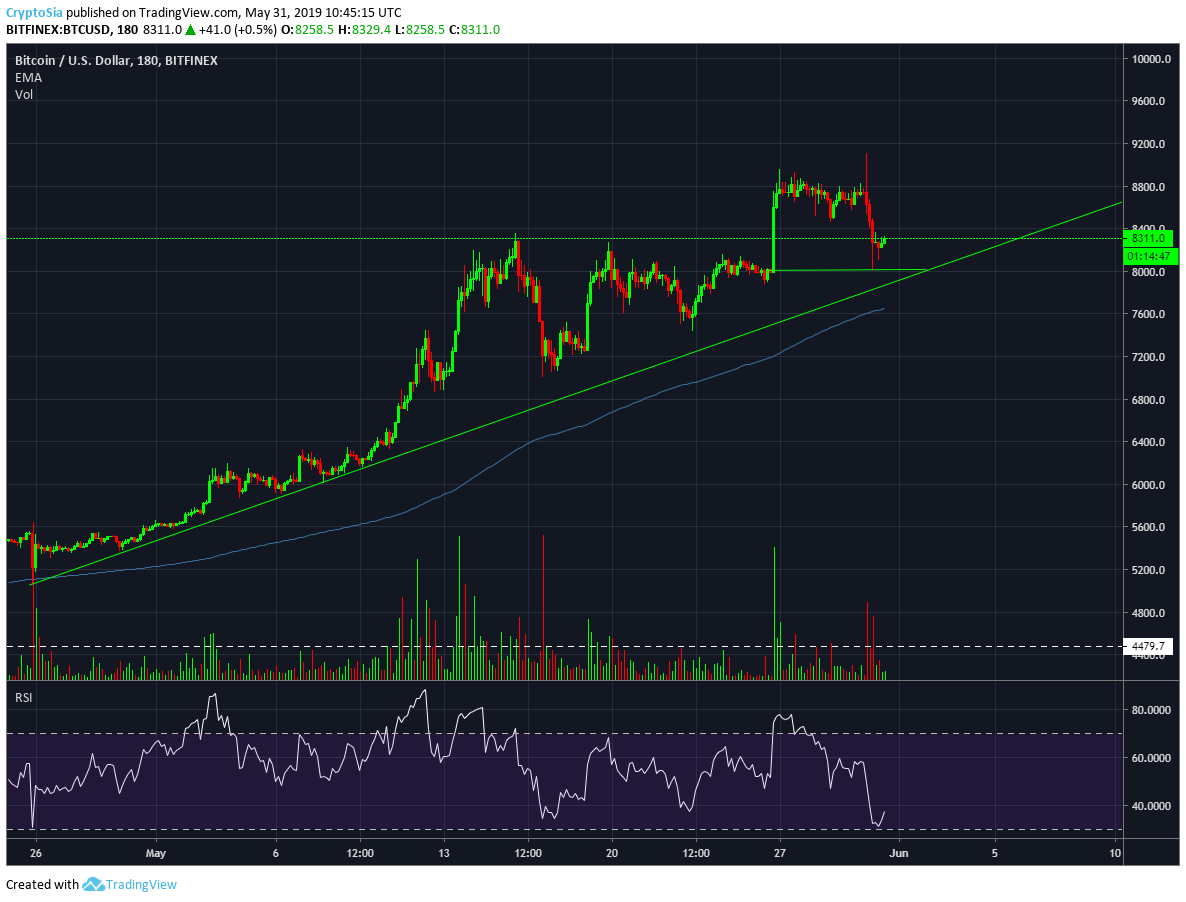
BTC/USD chart provided by Tradingview
Moving over to a 15min time frame, we will look to RSI to tell us when we can expect this dump to end. We had a look at previous opportunities on the chart with a similar structure forming on Bitcoin. Here we have a trade that was made in 2018 that looks pretty similar to today's action.
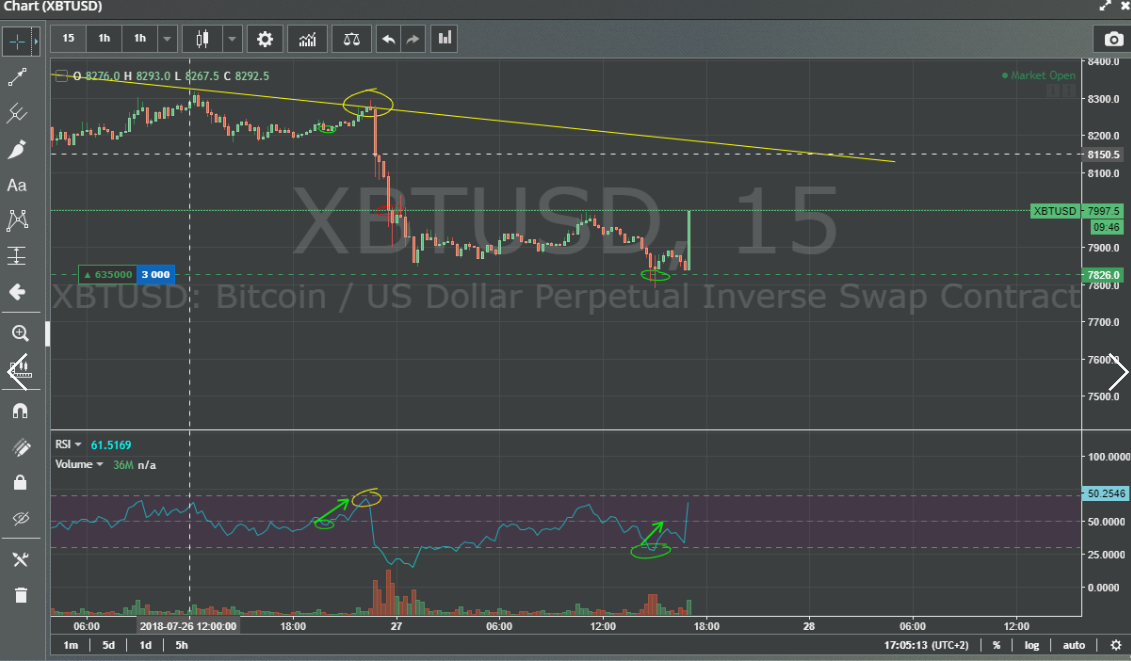
BTC/USD chart provided by Tradingview
Now if we look at today's chart, we are able to see the similarities in RSI. Price dumped hard with RSI pushing below 30. Momentum then pushed back up and found resistance at 50 line before moving down again. Currently RSI will attempt to reach the 70 RSI, before it then dumps back down to 30 RSI. This will cause price to make a lower low, and RSI to make a higher low, aka Divergence, which is the perfect entry signal. What follows then is a sharp move to the topside.
Whether we are able to push back above $9k will rely on momentum and we wil have to wait and see how it plays out. The 3 hour chart tell us that if momentum returns to the trend, we will see Bitcoin recover to a price of $8800. For now though we wait for Bitcoin to complete its final push down and to form Divergence.
Do you think Bitcoin can go back above $9k, or are we now on the way down to $6k? Let us know what you think in the comments below!
Disclaimer: Keep in mind this not investment or trading advice, just the opinion of our analysts. As always, do your own research, make your own decisions.