With Bitcoin's price finding a stable ground at around $8600, many people are wondering if we are due for a correction or if this is simply the path to continuation. This is the Bitcoin Price Analysis for May 29.
Highlights:
- $BTC trend holding strong
- Possible bear trap forming
- Is a correction overdue?
The good
Having a quick look at the daily we notice that BTC is currently resting on the $8.4k support line, which used to be tough resistance. We can also see that RSI is still above its trend line that we drew from our previous analysis, showing us that this up trend is still holding. If we manage to stay above this trend line, then $10k is our next stop.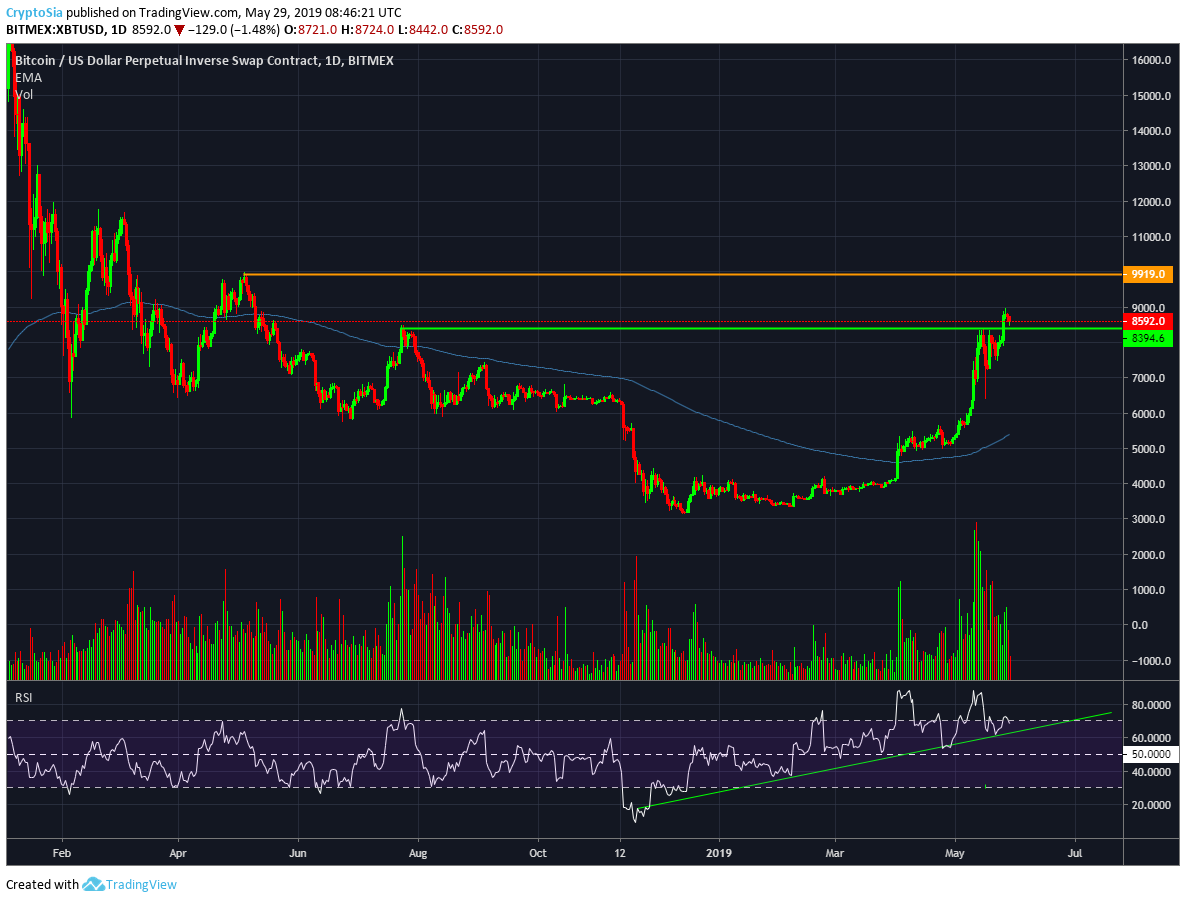
BTC/USD chart provided by Tradingview
On the hourly we are able to spot a few bear traps that occurred this past week. To spot a bear trap all we need to do is draw a support line on RSI that touches the most lows. What you then find is places where momentum pushed outside of the trend, and not long after returned back to the trend. Currently it seems that another bear trap is forming, but it's preferred that the trap happens closer to the 200EMA, so we have to be a bit more patient to see how it plays out.
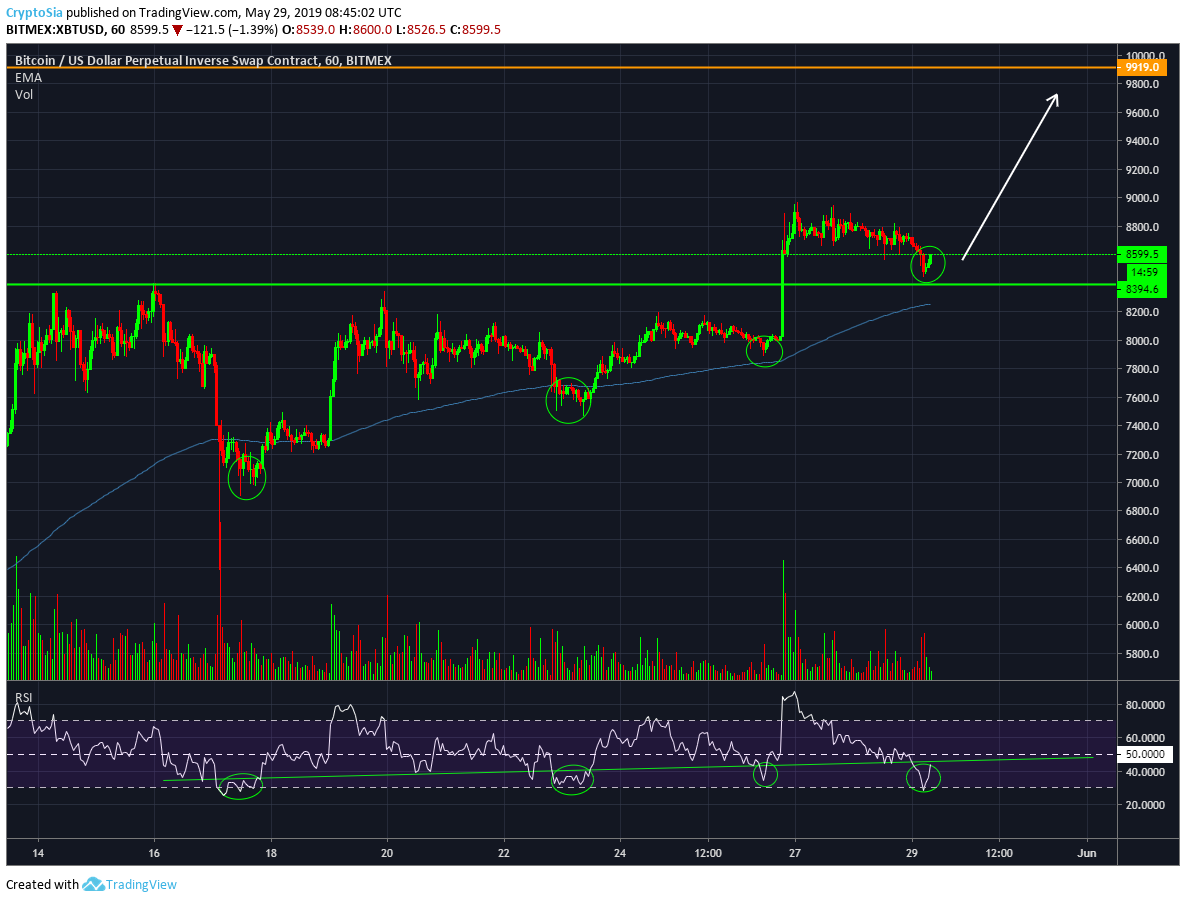
BTC/USD chart provided by Tradingview
The bad
Looking for some bearish signs on the daily, we straight away see that volume is decreasing as price is rising, and as we know this is a bearish sign. Although the 200EMA is pointing upwards, it is still far away from current price. A dip to the 200EMA would be a 36% decrease for Bitcoin, and would put as back to the $6000 levels.
On the RSI we notice that it has not been near the 50 line since 26 of April, indicating that price has not fallen back to proper support levels. Lastly we also spot some minor Divergence forming, with price making a higher high and momentum making a lower high on RSI. I would not put too much faith in this Divergence as more or less the same structure failed us the previous time that this occurred in April.
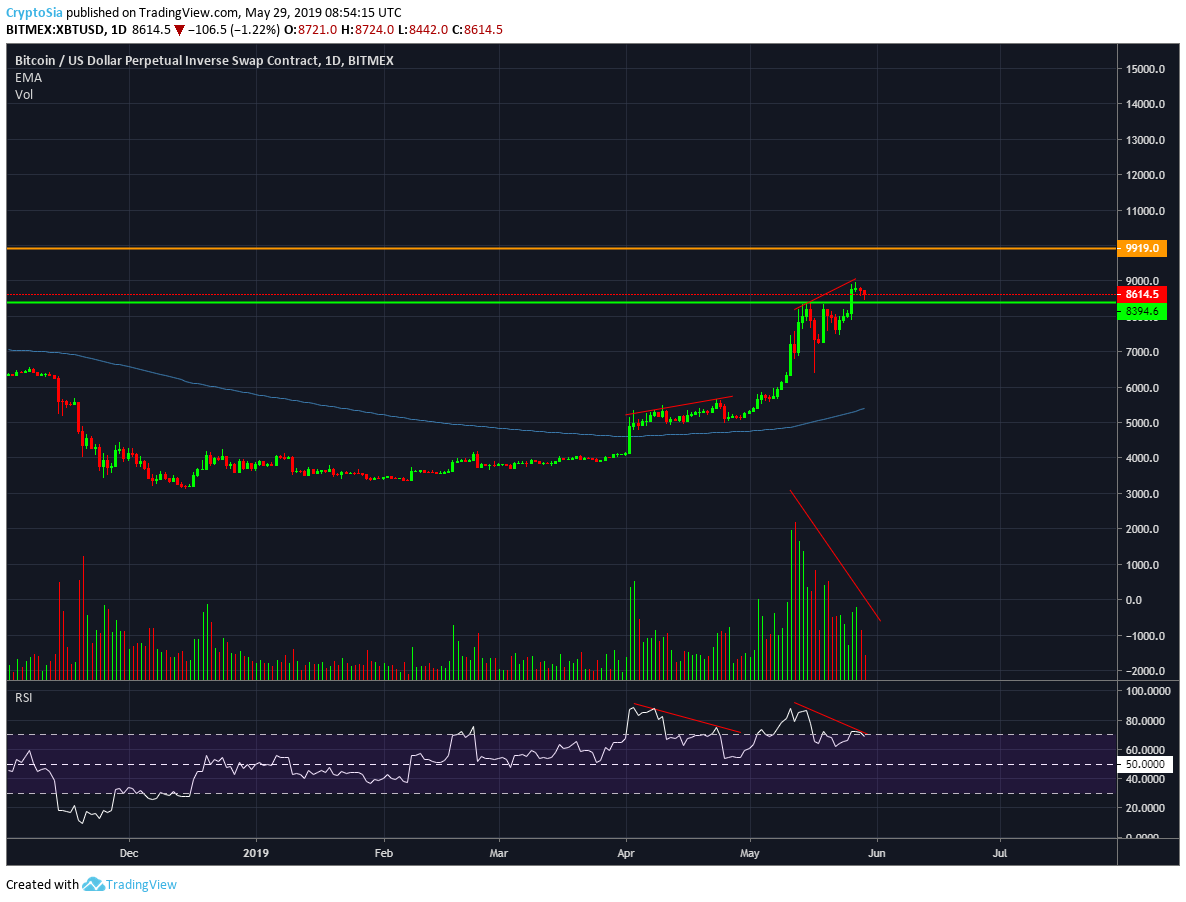
BTC/USD chart provided by Tradingview
As we wait for Bitcoin to decide wether it wants to go up or down, we can look to altcoin for possible moves. If Bitcoin continues to trend down/sideways then we can expect alts to rise, as people are always looking to put their BTC where it can gain value.
Can Bitcoin keep pushing to new highs, or is a correction long overdue? Let us know what you think in the comments below!
Disclaimer: Keep in mind this not investment or trading advice, just the opinion of our analysts. As always, do your own research, make your own decisions.