After the prices’ roller coaster ride last week, Bitcoin [BTC] recorded its highest search volume on Google over the past year. The king coin was priced at $7,827.95 with a market cap of $130 billion, at press time. The 24-hour trade volume came up to be $24.6 billion, out of which BitMEX contributed 10.76% via XBT/USD pair. Bitcoin [BTC] fell by 1.01% over the last 24-hours, at press time.
Litecoin [LTC] was priced at $90, with a market cap of $5.56 billion. The 24-hour trade volume came up to be $3.4 billion out of which, Coineal contributed 10.28% via LTC/BTC pair. Litecoin [LTC] fell by 0.82% over the last 24 hours, at press time.
1 Day- BTC

Source: TradingView
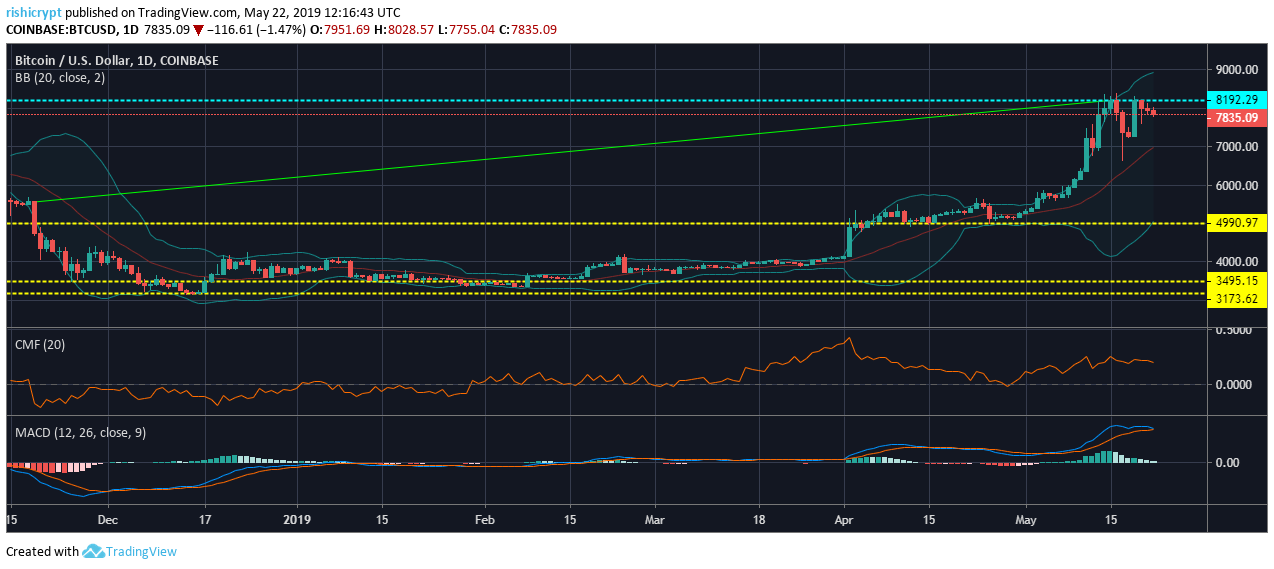
The 1 day chart for BTC showed an uptrend from $5,5560 to $8,203.32. The support points stood at $3,173.62, $3,495.15 and $4,990.97. The point of resistance was seen at $8,192.92.
The Bollinger Bands indicated volatility in price as the bands were diverging.
The Chaikin Money Flow showed that the flow of capital into the market was more than the outflow, indicating a bullish trend.
The MACD indicator displayed a bullish trend, but hinted at a bearish crossover.
1 Day- LTC

Source: TradingView
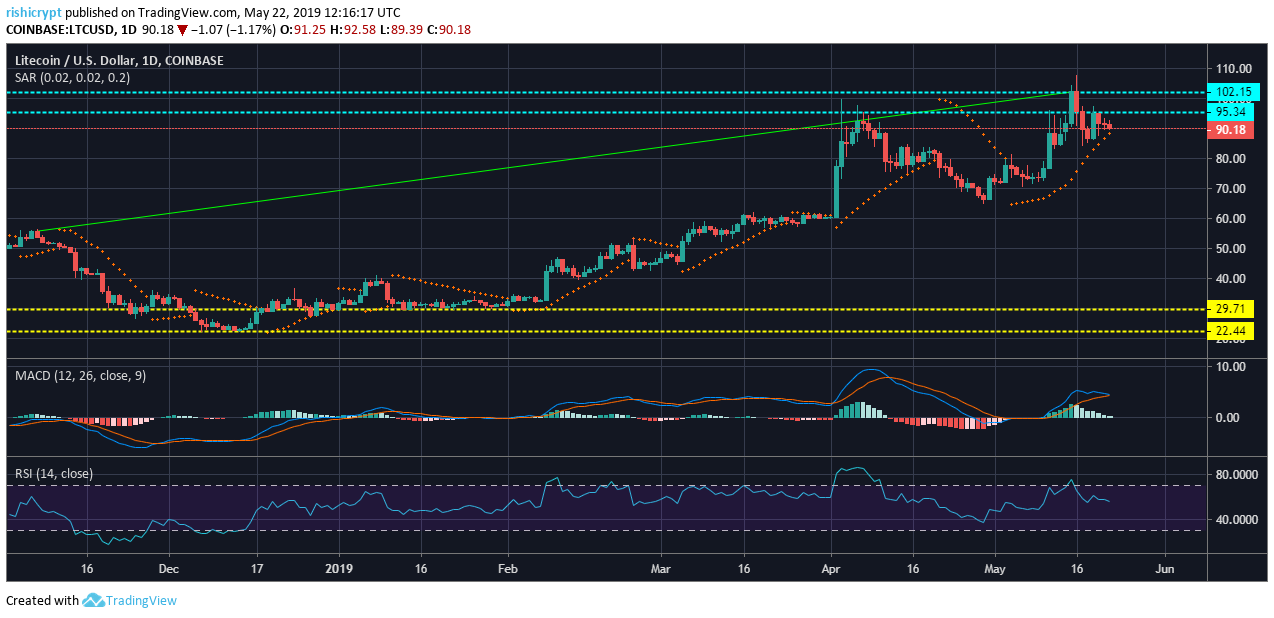
The 1 day chart for LTC showed an uptrend from $55.88 to 102.26. The support points were at $22.44 and $29.71. The resistance points stood at $95.34 and $102.15.
The Parabolic SAR indicated a bullish trend as the dotted markers were formed under the candlesticks.
The MACD indicator showed was bullish, while suggesting an imminent bearish crossover.
The Relative Strength Index indicated a bullish trend as it was close to the overbought zone. But, the graph was seen to moving downwards.
Conclusion
The 1 day chart for BTC and LTC displayed a bullish trend, but hinted at an imminent bearish move as indicated by the aforementioned indicators.
 ambcrypto.com