Bitcoin (BTC) Price Prediction
Bitcoin (BTC) Price – The cryptocurrency market has been quite interesting in itself, with a Bitcoin breaking its ceiling of $ 5200 and remaining firm above this level to try to reach $ 6000 in the medium term, as we predicted in our previous post on the cryptocurrency.
Good news for the ecosystem. The unstable and weak dollar against Euro due to the worries of global warming and an escalation of conflicts in Libya that highlight the volatility of oil have caused many institutional investors and unconventional have tilted their gaze towards the new digital gold, beyond the traditional ingot as a safeguard of value.
Last week’s milestone of the maximum of BTC transactions in a week since 2017, puts in context that the cryptocurrency is being increasingly used as a speculative instrument of rapid return. Beyond use cases to safeguard of value in hyperinflationary countries such as Venezuela, where people acquire the cryptocurrency to escape the hourly assessment they suffer with their national currency.
Also Read: $20,000 Bitcoin Price Will Be A Tiny Blip, Says Ultra-Rich Investor At Kraken Exchange & BitBay
If the use cases around the underlying technology of Bitcoin, such as blockchain, continue its course as shown so far, we may see Bitcoin easily arrive at the year maximum projected value in our previous five-digit post for the leading cryptocurrency.
At the time of writing, BTC is once again proving that the April Fools was just an excuse to leave behind the crypto winter. Its price is now $ 5224.53 per unit and it has a moderate growth in full corrective scenario of prices of the entire ecosystem, of + 0.04%. Its volume has grown to a staggering $ 92 billion, as its intraday volume also increased to $ 15 Billion.
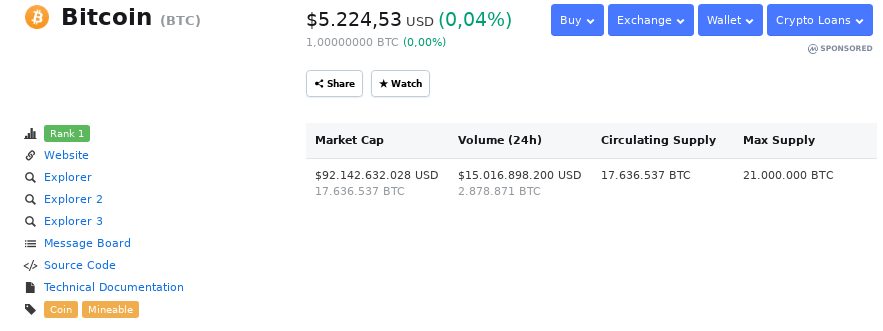
The market capitalization of the whole ecosystem has recovered in the last hours to go back to the top of the $ 180 billion and BTC is still increasing its dominance with 51% at the time of writing.

Technical Analysis of Bitcoin (BTC) Price
According to the 1D graph of Bitcoin, we see a downward trajectory that is progressively changing over the last few months.
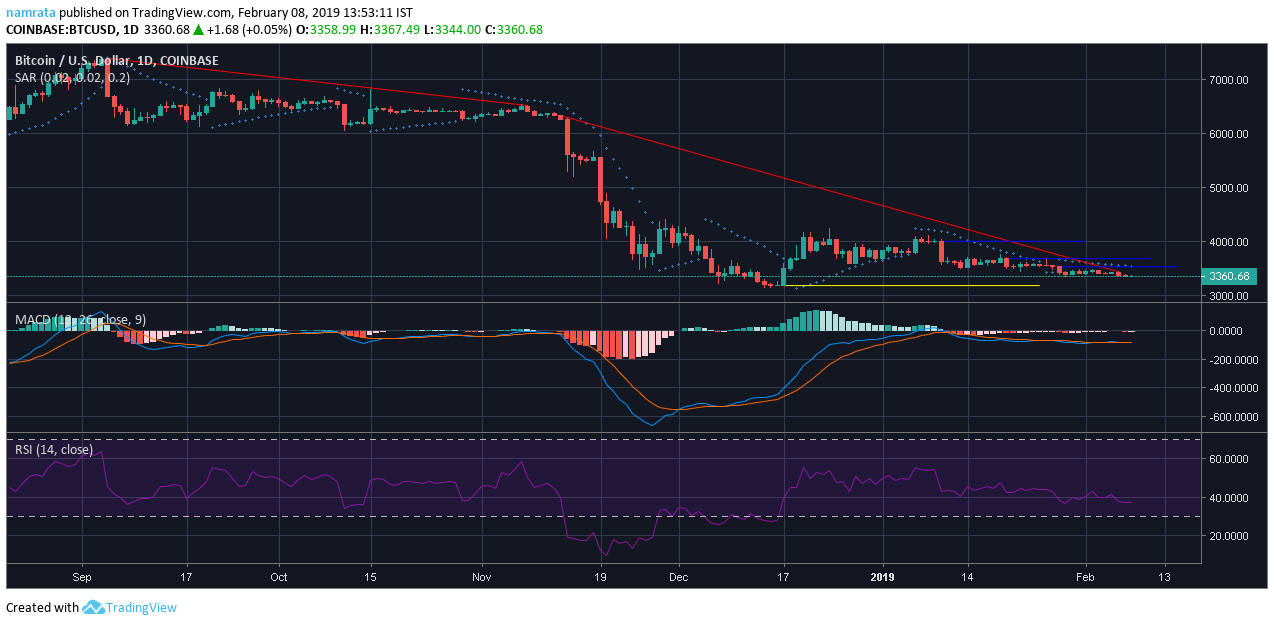
The bearish pattern has been broken at the beginning of this month as we can see on the chart, the tangent projected on the maximum (green line), thus generating a series of progressive supports that have been strengthened as the rally keeps going up.
In fact, BTC has generated a new pattern with immediate resistance of $ 5860, as the closest value to beat in this month of April.
This optimistic scenario is supported by the Aroon Uptrend indicator (green line), which remains at the top of the graph, while its counterpart does not rise despite the corrective panorama of prices that the ecosystem in general is suffering today. Good indications for those who invested late in BTC, last week.
How Long Can BTC Continue with this Bullish Rally to Reach ceiling of $ 5800?
The answer seems to be that in the short term and for that we will analyze a couple of graphs and interesting data about it.
First of all, as we have already seen BTC broke the progressive bearish trend that had been coming since March last year in the increasingly lower maximums created in the previous graph.
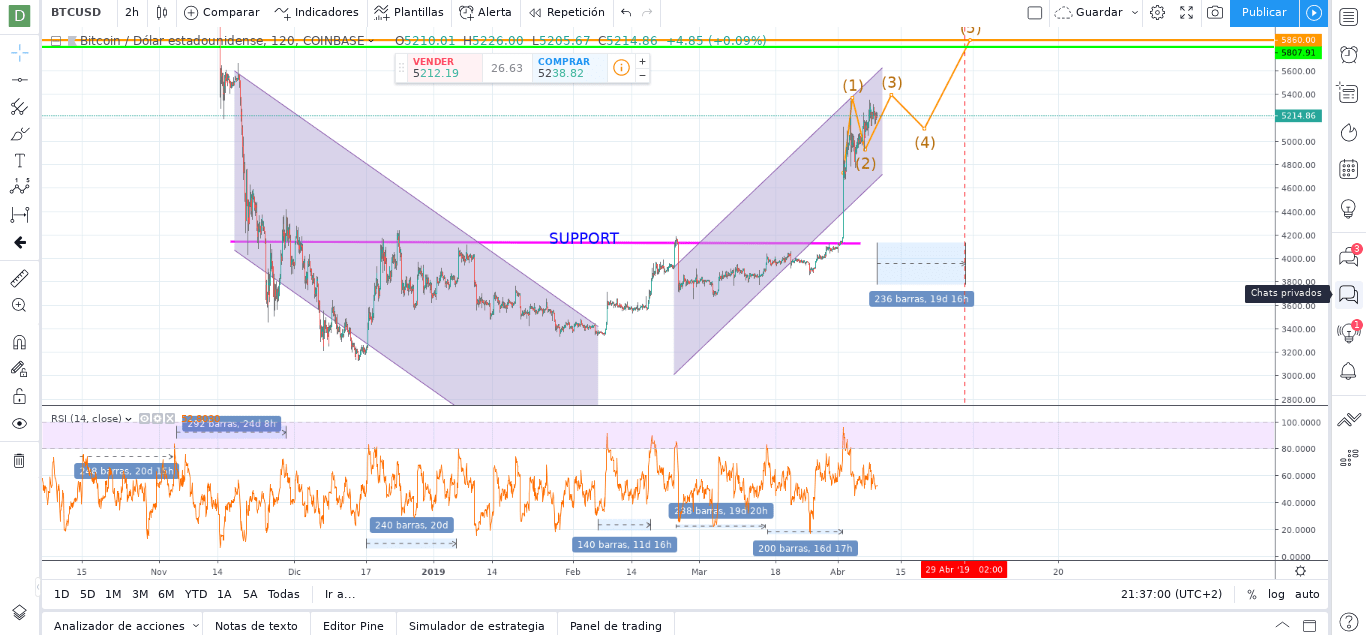
In the 2H chart, BTC has created an interesting wedge pattern and support that we did not see it generate from 2016-2017. Thanks to the strong support band that stays at levels of approximately $ 4200, and that has been exceeded in day one of April.
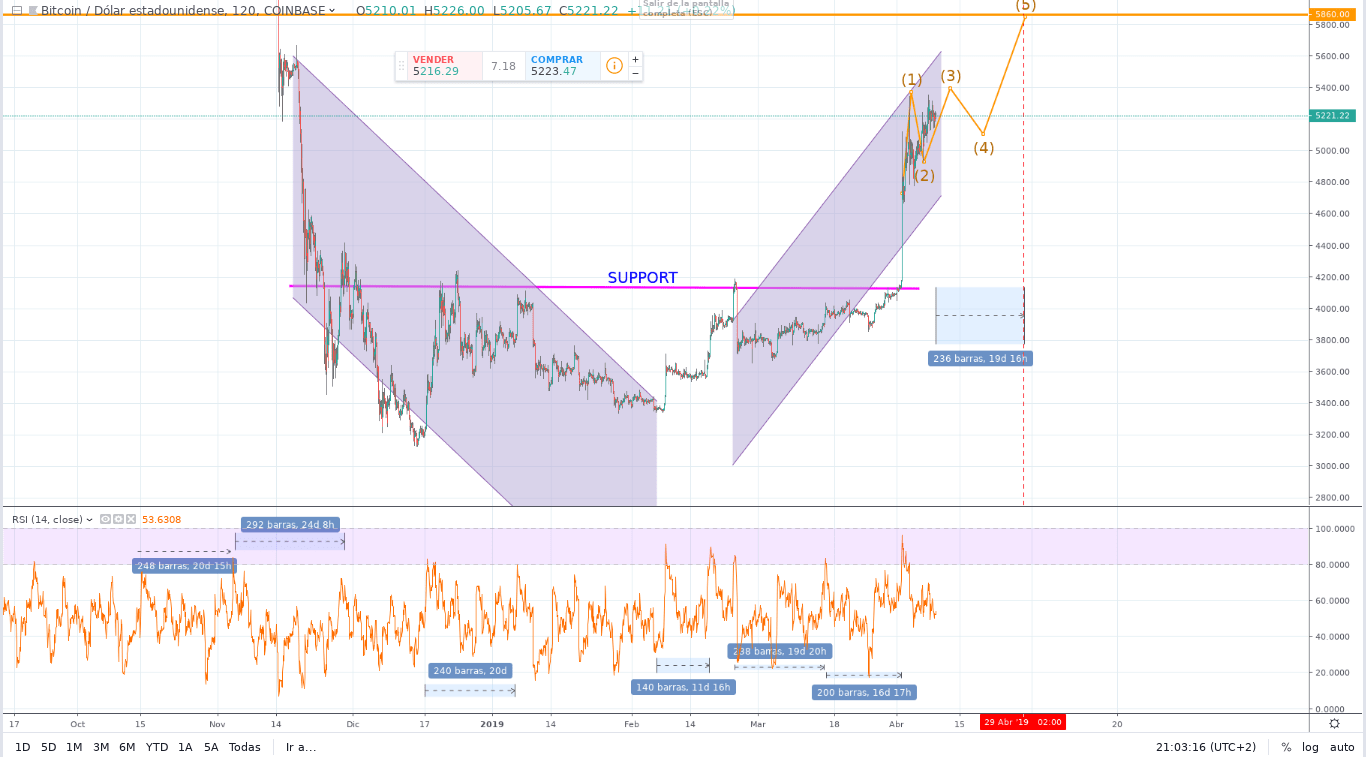
The graph shows another interesting fact, and that according to Elliot wave triple correction, BTC is generating its second wave to reach levels of R1 ($ 5860) by the end of April 2019.
The foregoing is based on the first RSI calculations obtained at the highest levels in the last two quarters, which projects an average of a repetition of the overbought RSI cycle for approximately 19 days.
Also Read: Michael Novogratz: Sell Litecoin (LTC) And Buy Bitcoin (BTC)
Let’s see more about this projection. According to the previous graph, BTC has created these values in the last six months:
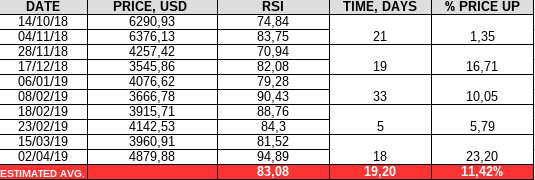
We can also check this directly on the chart and make an average dates between the time taken to produce the maximum RSI and price caps, weighing it on a logarithmic scale.
If we compare the graphic value obtained with the calculation made in the table based on BTC’s historical price record, we can observe the similarity of a 19-day average that repeats a new price increase in BTC and a maximum value of RSI in the last six months.
Given that our position is to find in a short term investment horizon to know what will be the tentative date for BTC to reach the value of $ 5800, we simply observe that said value mathematically coincides with the graphic projection of ELLIOT for the end of APRIL 2019.
Thus, we have that at the current price <at the time of calculation>:

Bitcoin should achieve the barrier of $ 5800 by the end of the month, if no extraordinary event happens that avoids this goal or on the contrary that accelerates it.
Now let’s verify the above with one more graph and see how the additional indicators behave to the Aroon and RSI indicator already shown in the previous graphs.
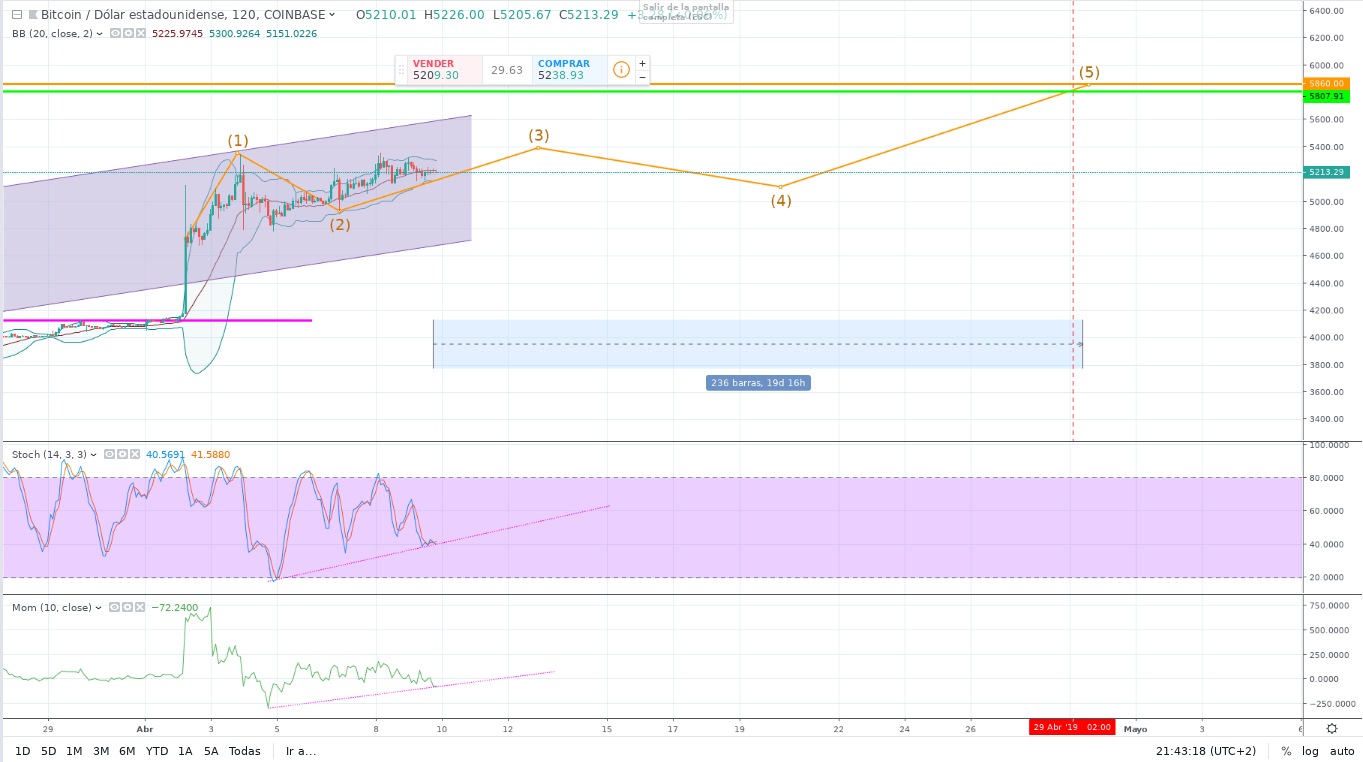
As we can see in the extended 120-minute chart of BITCOIN with indicators, the scenario is optimistic for our projection.
Bitcoin (BTC) Price Bands is on a Bullish Rand
The Bollinger Bands have begun to contract, a sign that BTC price volatility is no longer a problem in the short term. Also in the last two days, BTC has achieved more than Bollinger’s external sails, which indicates that it is close to breaking the psychological ceiling of $ 5300.
The Stochastic indicator projects a positive tangent, even though the purchase-sale levels at the time of writing are below 50, promising a new upward wave for the middle of the current month.
Also Read: China’s Ban on Mining To Push Bitcoin (BTC) Price Up –Senior Analyst At eToro
Finally, the Momentum indicator is currently in the negative, indicating that the BTC price correction trend is underway with pressure from bearish drivers to drop the currency into the next rally with strength and profit margins.
BTC is creating new support in this band and this new maximum support allows us to infer together with its positive slope that when BTC manages to change the trend of MOM up, it would mean a higher projected value perhaps above $ 6000.
As we can see, the main cryptocurrency is increasingly creating minimum highs, even though this may be confusing for many in trading, it means that higher price levels are coming for the digital asset.
If this behavior is confirmed in conjunction with the external factors analyzed at the beginning of this post, we could be back from a possible bullish rally that would lead BTC to achieve five-figure values at the end of the year.