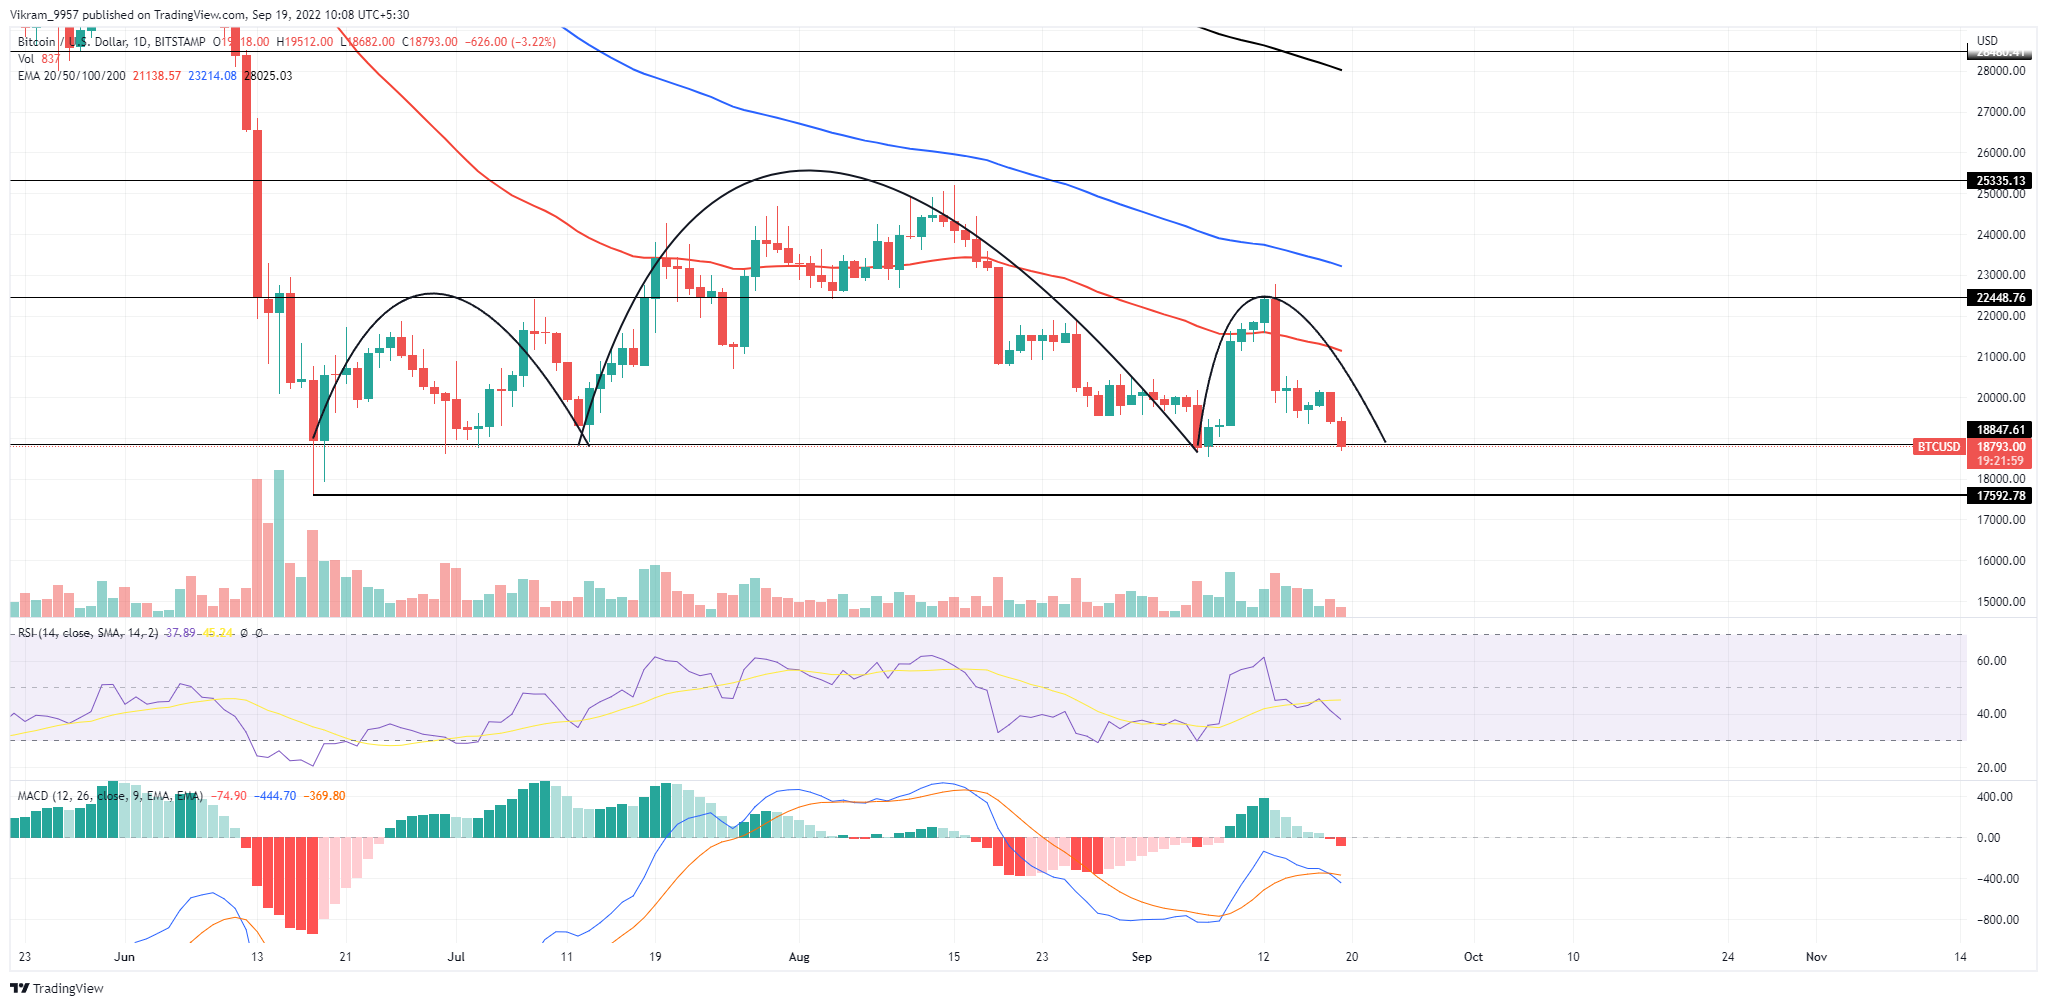
The BTC price action shows a head and shoulder pattern forming at $18,800, teasing a crash in Bitcoin prices to the $15K mark. The BTC Technical Analysis shows increased selling pressure over the weekend, resulting in a 6% downfall in the last 48 hours. Also, the falling Bitcoin prices crack under the $18,850 support level with 19 hours left on the daily clock. So, will the bearish pressure keep the closing price below the neckline to give a head and shoulder breakout?
Key Points:
- The Bitcoin prices show a bearish breakout of $18,850.
- The bullish failure at $18,850 can drop Bitcoin to $15K.
- The intraday trading volume in Bitcoin is $35.02 billion.
 Source - TradingView
BTC Technical Analysis
The BTC price displayed an increasing selling pressure on 13th September, resulting in a 10% downfall from the $22,500 resistance level. The decline results in a bearish engulfing candle and prolongs the downtrend to the $18850 level over the week. During the weekend, the selling pressure boosted, resulting in a 6% drop in BTC prices. Currently, the buyers at the $18,850 demand level struggle to assert dominance over the price trend and avoid a bearish breakout. Additionally, the price action spotlights a head and shoulder in the daily chart with the neckline and the $18850 support level. Therefore, the downfall below this crucial level will unleash the trapped bearish momentum and create a new 52-week low in the BTC technical chart. With 19 hours left for candle closing, the daily candle shows a 3.14 percent decline in market value and cracks on the $18,850 horizontal level. If the closing price breaks the bearish pattern, traders can expect a high momentum bearish trend, crashing Bitcoin to $15,000. However, a reversal in BTC prices reclaiming the $19,000 mark will void the bearish theory.
Technical Indicators
The RSI slope shows a falling trend below the halfway line after failing to rise above the 14-day SMA. Moreover, the MACD and signal lines give a bearish crossover starting a negative trend in histograms. Therefore, the technical indicators reflect a solid underlying bearishness. As a result, the BTC Technical Analysis takes a bearish standpoint and offers a selling opportunity with the pattern breakout. Resistance Levels - $19000 and $20000 Support Levels - $18850 and $17750
 cryptoknowmics.com