
Bitcoin have retreated to a crucial area of support that served as the upper limit of the negative movement in late June at the 18,000 range.
Bitcoin Breaks Crucial Level
After falling below the bear flag at the middle of August, prices were able to fall further on a break of 20,000 before reaching a crucial area of support at around 19,600. Although it has just returned to action, this level has also served as a critical source of resistance for the leading cryptocurrency since 2017.
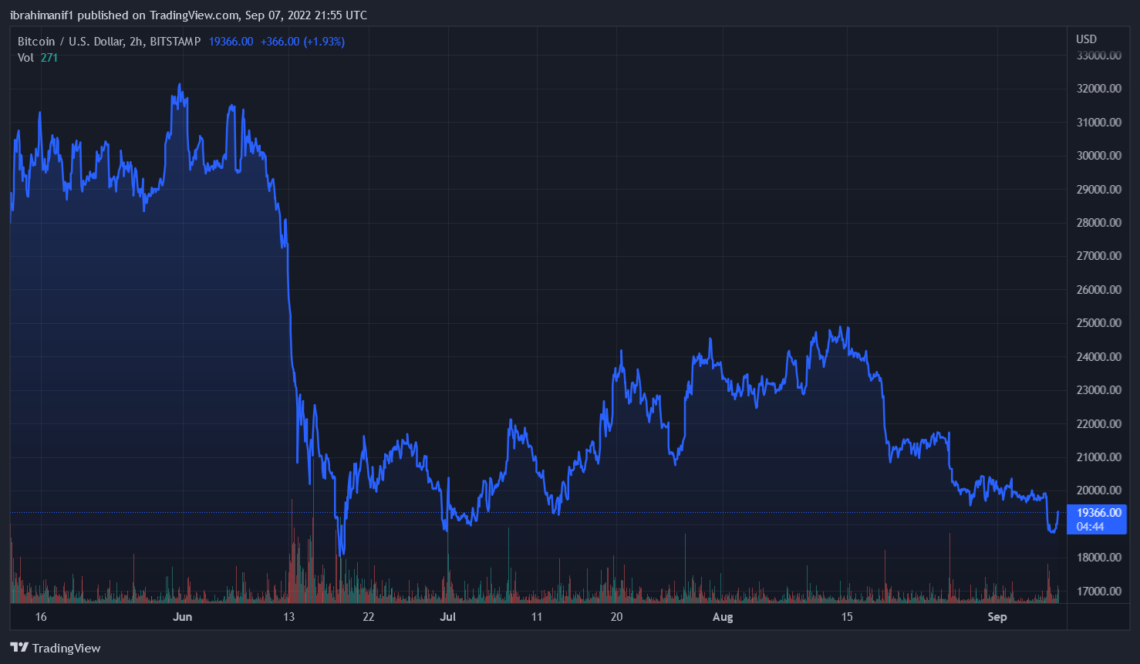
$BTC/USD falls below $20k. Source: TradingView
This places a strong downward pressure on Bitcoin as it moves into September. Additionally, according to cryptocurrency expert Ali Martinez, Bitcoin’s market share has fallen below 39% for the first time since 2018.
For Bitcoin maximalists, this is troubling news as alternative cryptocurrencies continue to overtake the cryptocurrency monarch.
Popular cryptocurrency analysts have also drawn attention to a concerning trend in Bitcoin’s prior September performance.
For instance, according to one expert, Bitcoin has experienced a losing month-end in nine of the last twelve Septembers. On September 7th, Glassnode reported that 19.29 million $BTC addresses had losses.
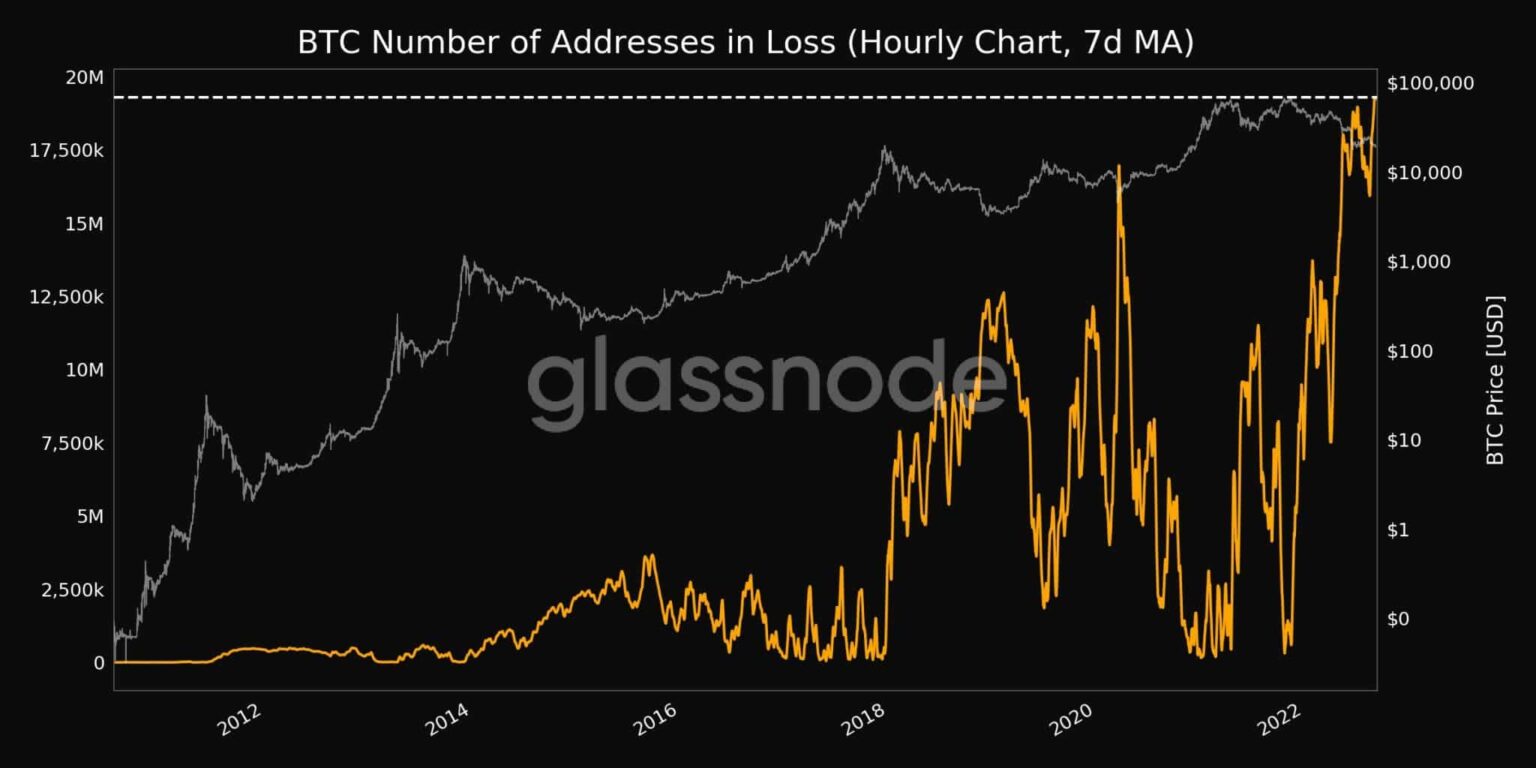
Source: Glassnode
When $BTC/USD hit an all-time high of $19,666 on December 17, 2017, it reached its pinnacle. Since then, a breach of this zone in December 2020 has driven an upswing that has helped the major cryptocurrency increase before reaching a new record high of $69,000 in November of last year.
Selling pressure has returned prices below the late-June low of $18,595, following a fall below previous support that had turned into resistance.
Price May Crash Further
In the event that prices drop further, a break of the $18,000 psychological level could lead to a retest of the $17,792 level, which represents the 78.6% retracement of the move from 2020 to 2021, with the December 2020 low of $17,569 serving as the next level of support.
The four-hour chart shows how these historical levels have created zones of confluence that continue to keep both bulls and bears at bay as short-term price movement oscillates between $18,500 and $19,000. Retests of $19,666 and the subsequent layer of resistance at $20,418 are likely on the upside if the price rises above $19,000 and $19,500.
In a recent report, the Glassnode also mentioned a potential negative market movement from Bitcoin. It claimed that around 12.589 million $BTC, or over 65.77% of the total amount of $BTC in circulation, have been dormant for at least a year.
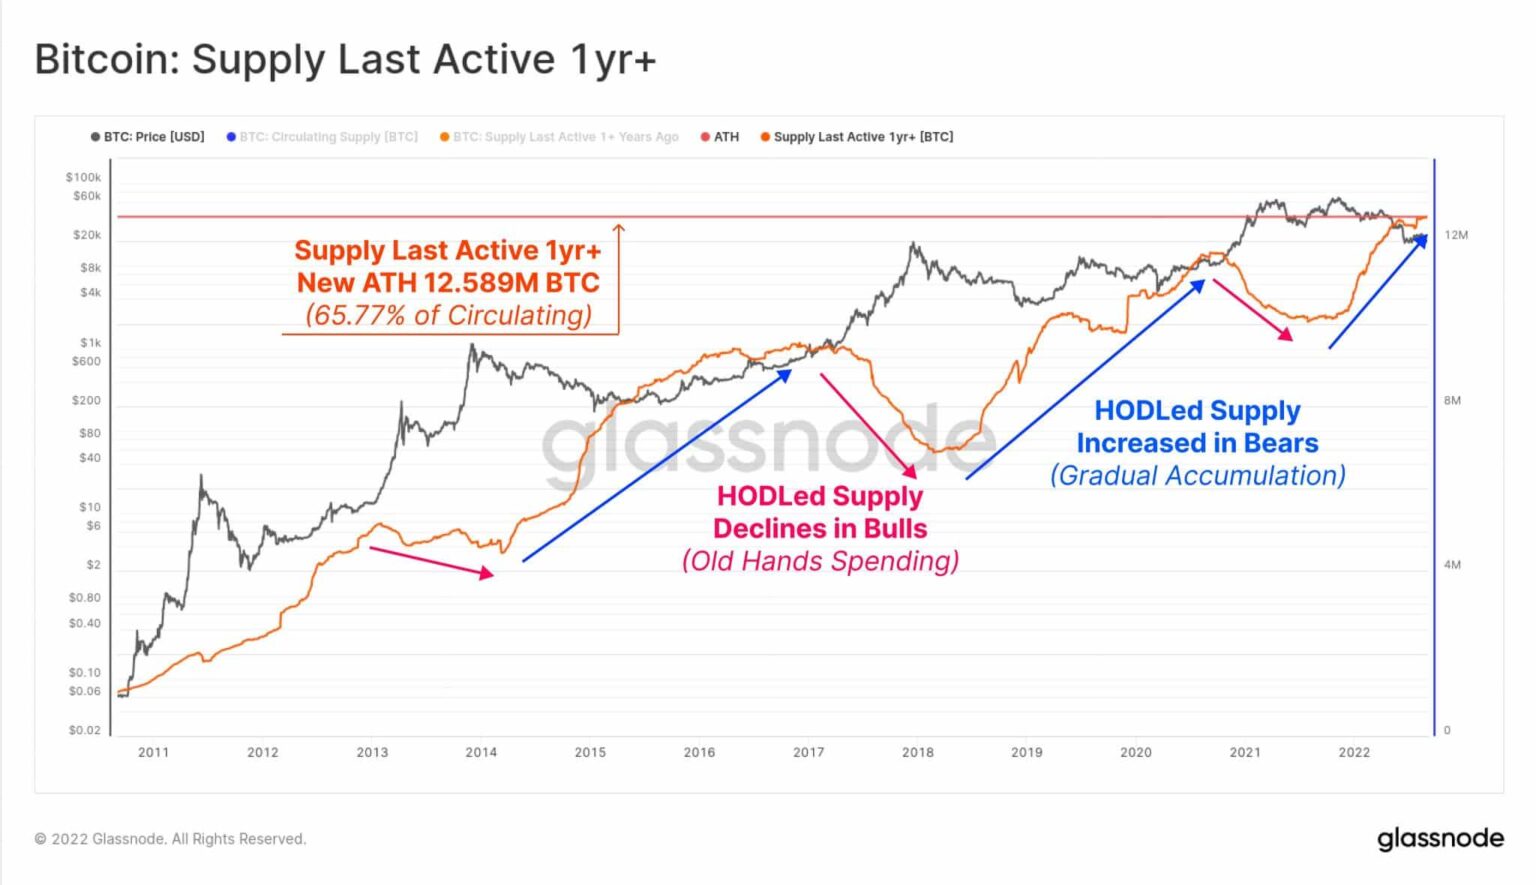
Source: Glassnode
In the past, “Bitcoin bear markets” have been characterized by an expanding inactive supply. The pain felt by maximalists who have been patiently waiting for a price breakout is increased by this.
Short-term volatility was predicted by BaroVirtual, a CryptoQuant-based author. The analyst studied the Net Unrealized Profits (NUP) trending pattern, which exhibits short-term periods of volatility.