
The GRT prices show a post-retest reversal from the broken resistance trendline of a falling wedge teasing a jump to the 100-day SMA.
Key Technical Points:
- The GRT prices jumped by 15% in the last 24 hours.
- The price action showcases a morning star pattern in the daily chart.
- The 24-hour trading volume of The Graph is $101 million, indicating a drop of 153%.
Past Performance of GRT
As teased in our previous article, the GRT prices failed to exceed the $0.128 resistance level resulting in a downtrend to $0.10. The downfall retests the broken resistance trendline of the falling wedge pattern in the daily chart. However, the buyers regain trend control with a post-retest reversal resulting in a morning star pattern. 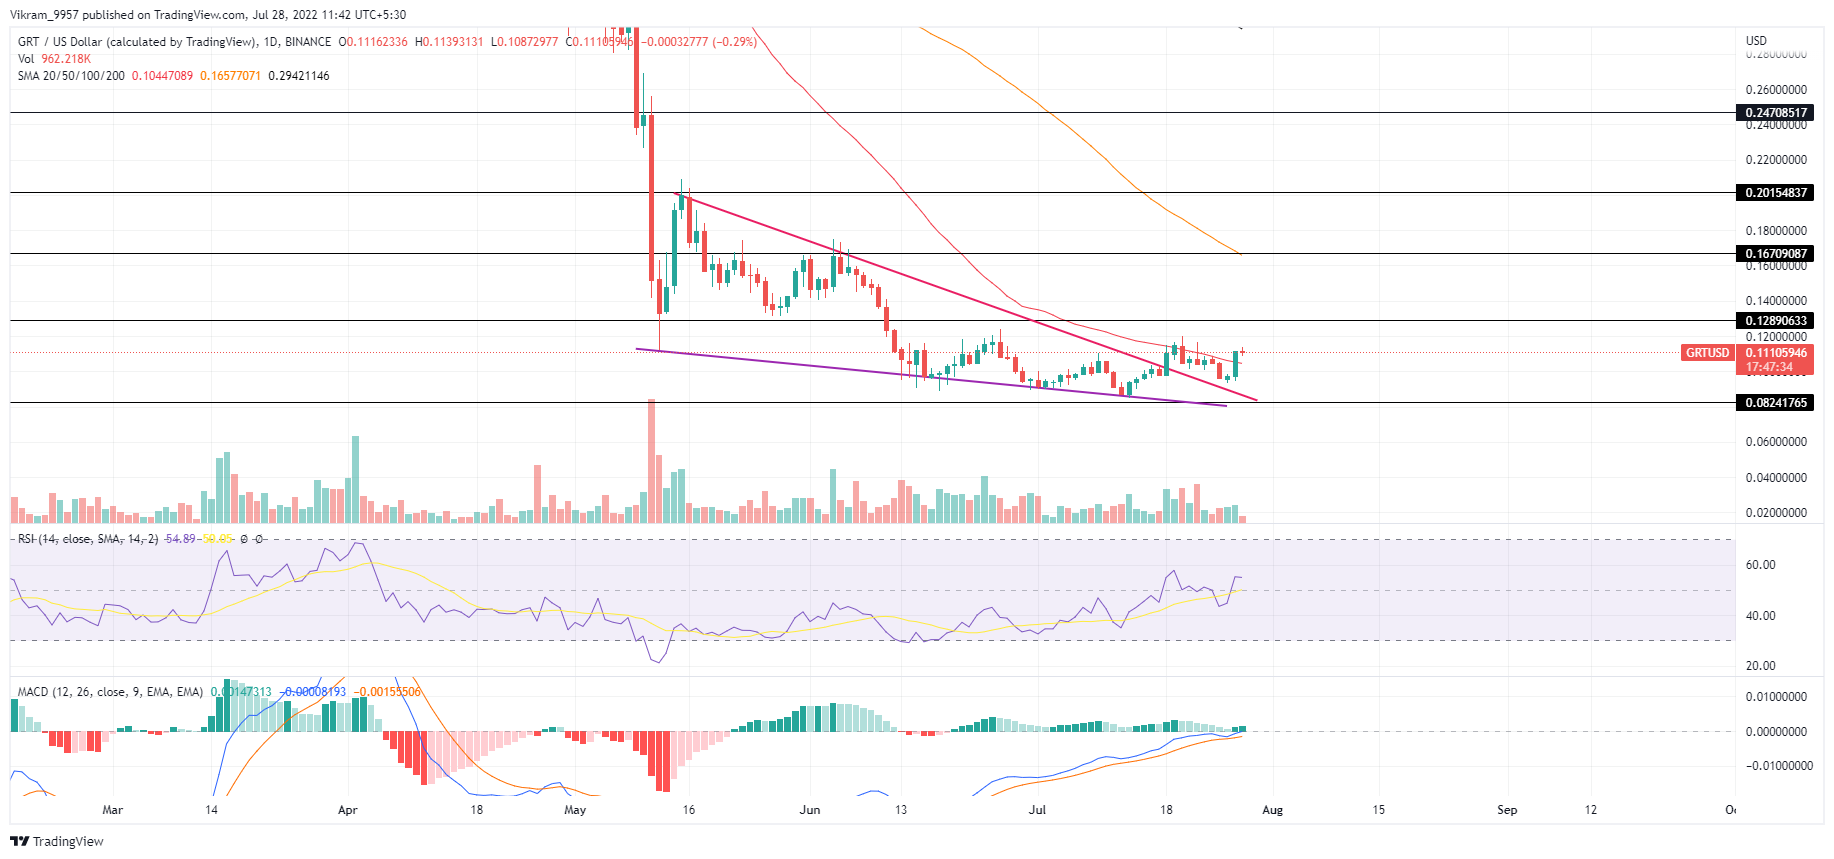 Source - Tradingview
GRT Technical Analysis
The overnight increase in the market value of the GRT prices propels it above the $0.11 level and completes the Morning star pattern. This increases the likelihood of a bullish trend continuation above the $0.128 resistance level. Currently, the market price sustains above the 50-day SMA after last night's increase in demand. Moreover, The 100-day SMA stands above the $0.128 resistance level to provide for the bearish opposition. The Bullish reversal within the daily RSI slope reflects an increase in the underlying bullishness as it surpasses the Halfway line. Furthermore, the MACD and signal lines avoid another bearish attempt and maintain positive alignment to reach the zero line. In a nutshell, the technical indicators support the GRT technical analysis reflecting a bullish intent and an increase in buying pressure.
Upcoming Trend
If the market continues to improve, the GRT prices will excel above the $0.128 resistance level and challenge the 100-day SMA at $0.16. Conversely, a reversal below the 50-day SMA will result in a downtrend below the $0.10 mark. Resistance Levels: $0.128 and $0.16 Support Levels: $0.10 and $0.08