Tron [TRX] has been one of the few cryptocurrencies that has enjoyed significant sporadic bullish rises in a highly bearish market. The ongoing price slide is the longest standing bear market in the history of the cryptocurrency market, which has affected major coins like Bitcoin [BTC], XRP and Ethereum [ETH]. At the time of writing, Tron was the eighth-largest cryptocurrency in the market, sitting above Stellar and Bitcoin SV to close the top-10 club.
1-hour:
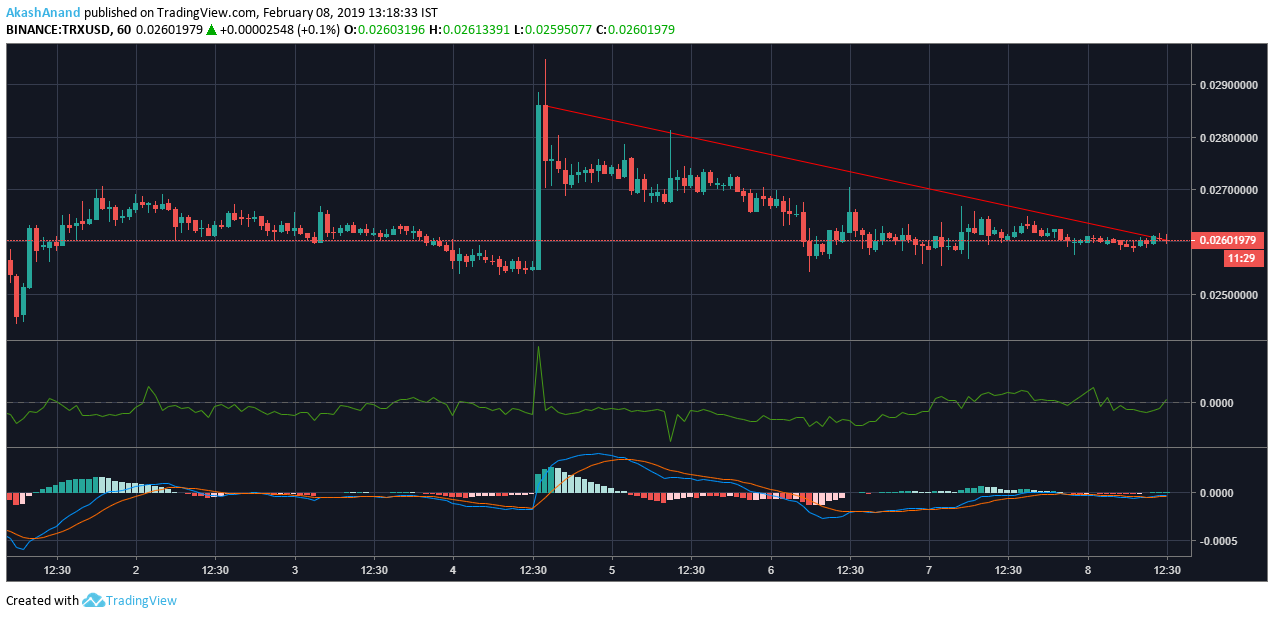
Source: TradingView
The one-hour graph for Tron shows a significant downtrend that resulted in the price dropping from $0.0286 to $0.026. The support has been holding at $0.0245 while the resistance is at $0.0286.
The Chaikin Money Flow indicator shows a slight spike up on the graph above the zero-line. This is a sign of the capital coming into the market being more than the capital leaving the market.
The MACD indicator is a typical example of the sideways movement in the market right now. The signal line and the MACD line have both started moving as a conjoined pair with the MACD histogram undergoing a lull at the same time.
1-day:
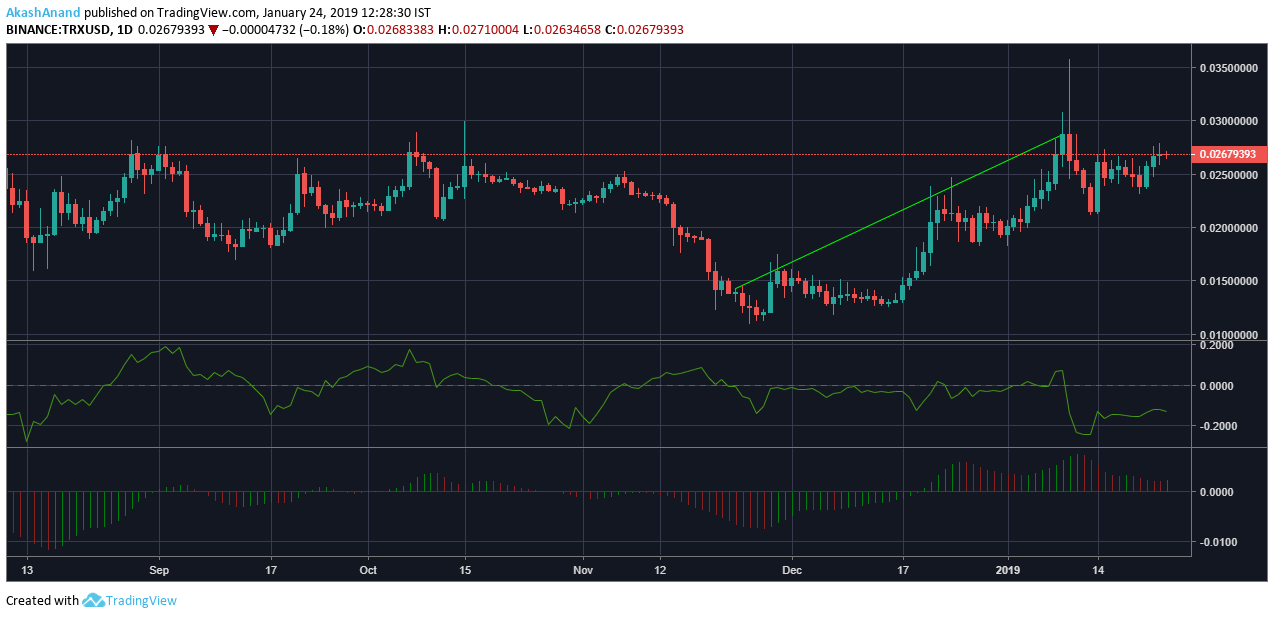
Source: TradingView
Tron’s one-day graph paints a better picture for the cryptocurrency with the visible uptrend lifting the price from $0.0132 to $0.0257. The support has been holding at $0.0117.
The Relative Strength Index puts the cryptocurrency close to the overbought zone. This is a sign of the buying pressure being more than the selling pressure.
The Awesome Oscillator displays a small spike on the chart, which means that the market momentum within Tron has increased, compared to earlier months.
Conclusion:
The above-mentioned indicators show a mix of bearish and bullish signals with the bull getting more votes. Tron is one of the few cryptocurrencies which has not yet succumbed completely to the bear, a sentiment that is not shared by the rest of the cryptocurrency market.