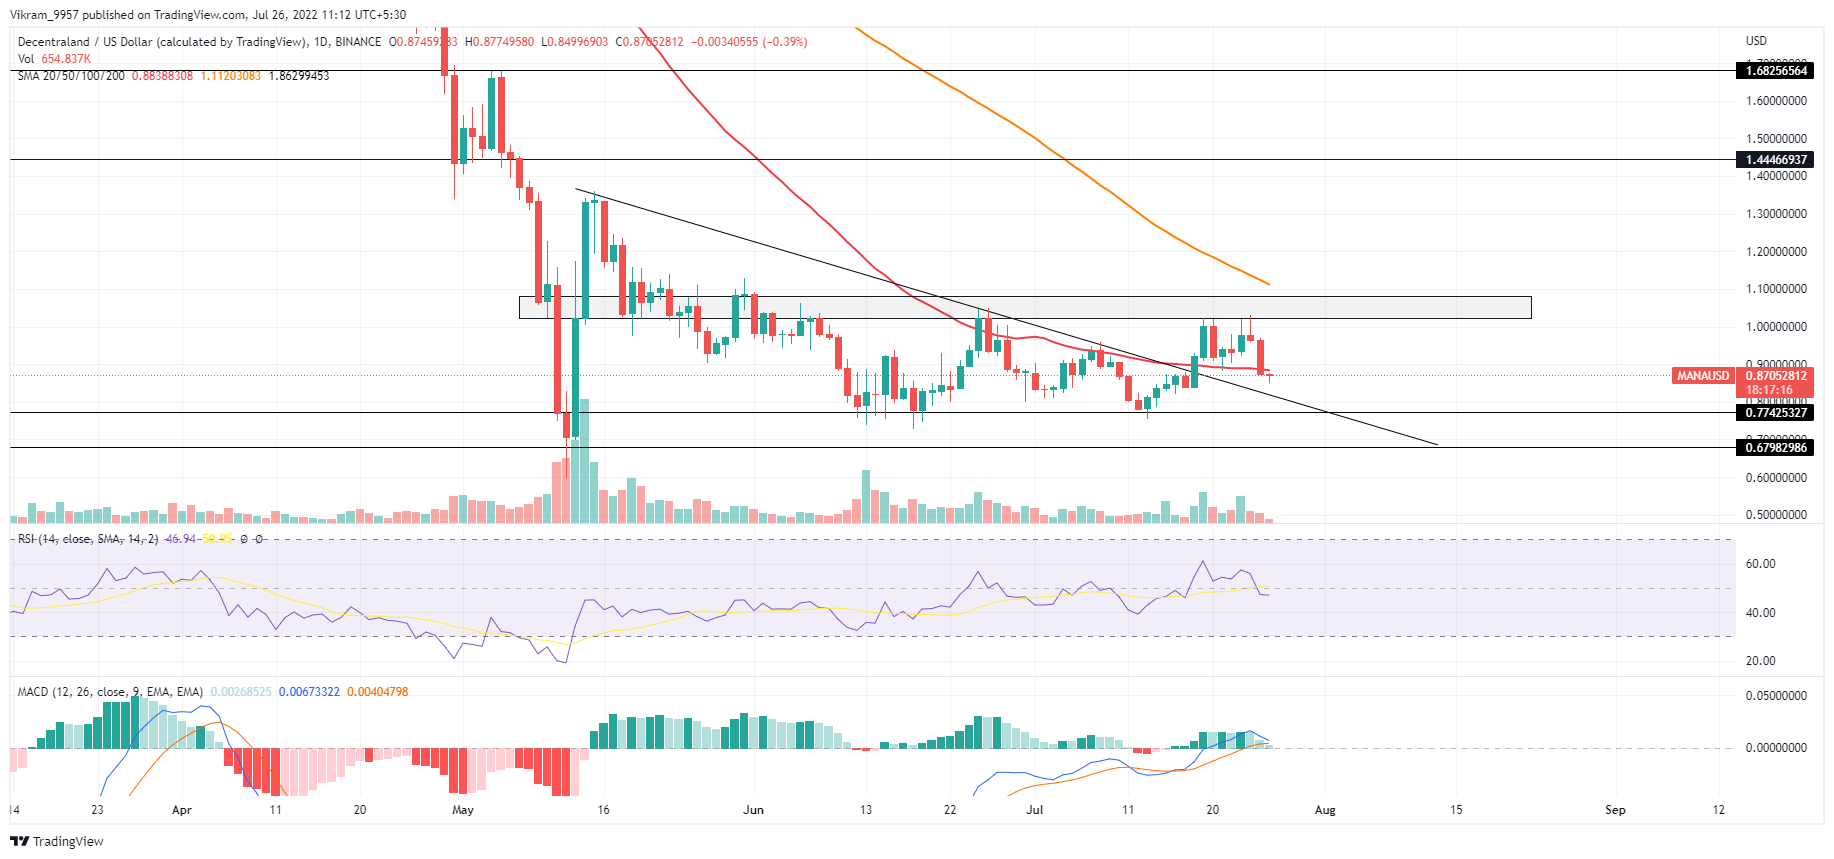
The Decentraland technical analysis shows how MANA prices fail to exceed the supply zone at the psychological mark of $1, leading to a retest of the broken trendline.
Key Technical Points:
- The MANA prices dropped by 5.52% in the last 24 hours.
- The falling trend retests the broken resistance trendline in the daily chart.
- The 24-hour trading volume of Decentraland is $228 million, indicating a drop of 8.03%.
Past Performance of MANA
As predicted in our previous article, the MANA prices break the resistance trendline to reach the psychological mark of $1. However, the breakout rally failed to exceed the $1 threshold leading to a correction phase, retesting the broken trendline. The price action forms an evening star pattern and echoes a double top reversal from $1 to break the 50-day SMA.  Source - Tradingview
MANA Technical Analysis
The declining trend in the trading volume during the downtrend showcases a lack of a bearish commitment and teases a post-retest reversal. However, the reversal rally will have to face the sellers at $1 again. As the market value of Decentraland's native token struggles to retain the 50-day average price, the lower price rejection brings hope for buyers. Hence, if the prices surpass the 50-day, SMA traders can expect a bull run reclaiming the $1 value. The sideways trend in the daily-RSI slope close to the halfway line restarts after the rejection in the nearly overbought zone. Moreover, the slope breaks below the 14 SMA, reflecting an increase in underlying bearishness. The MACD and signal lines fail to sustain a bullish spread leading to a high probability of a bearish crossover as the histograms decline. Hence, the indicator reflects an increase in selling pressure influencing the price trend. In a nutshell, the increased sales yesterday have influenced the technical indicators to give a bearish signal. However, the MANA price action analysis requests the traders to wait for the candle to close below the trendline before taking a short position.
Upcoming Trend
If the MANA dumps below the resistance trendline and the $0.77 support level, a downtrend to $0.67 seems unavoidable. Conversely, a post-retest reversal will change the bearish fate and might beat the $1 threshold. Resistance Levels: $1 and $1.44 Support Levels: $0.77 and $0.67
 cryptoknowmics.com