The Litecoin price analysis reveals a bullish trend today as it indicates a slight rise in the price levels. The coin showed good bullish price action during the past week as the price was recovering at a steady pace. But now, the trend line is slowly turning downwards as bears are showing strength. Nevertheless, bulls have taken the lead back today, and the price has slightly increased. However, the bearish pressure still weighs on the price function, and the trend can undergo a change at any time.
LTC/USD 1-day price chart: LTC is still at a loss of 2.70 percent despite the recovery observed
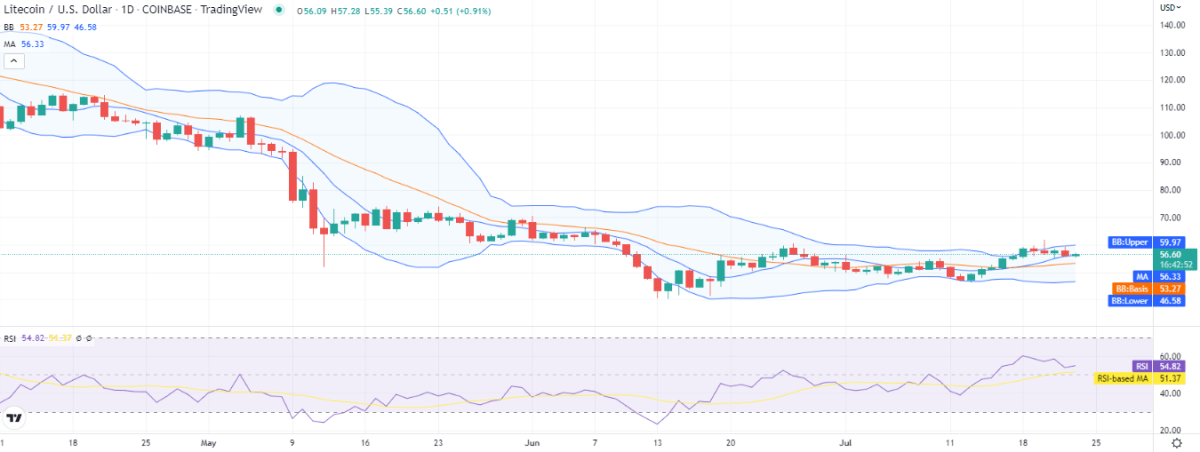
The 1-day Litecoin price analysis shows an increase in price today as the bulls are performing as per their capacity in the current situation, with the price reaching the $56.6 level. The coin is still at a loss of 2.70 percent for the last 24 hours; on the other hand, the coin is reporting a 10.18 percent increase in value over the past week as the trend was mostly bullish previously. The trading volume has only increased by 2.40 percent today, and the market dominance of LTC is currently 0.38 percent.
 LTC/USD 1-day price chart. Source: Trading view
The volatility is slightly high as the Bollinger bands are expanding slowly; the expansion of the Bollinger bands has resulted in its upper band reaching the $59.97 level representing the resistance, and the lower band reaching the $46.58 level representing the strongest support for LTC. Lastly, the Relative Strength Index (RSI) has also improved today, as it has climbed to index 54 on a slight upwards curve, hinting at the buying activity in the market. The moving average (MA), after traveling upwards, has also readjusted itself at the $56.33 mark, just below the price level.
Litecoin price analysis: Recent developments and further technical indications
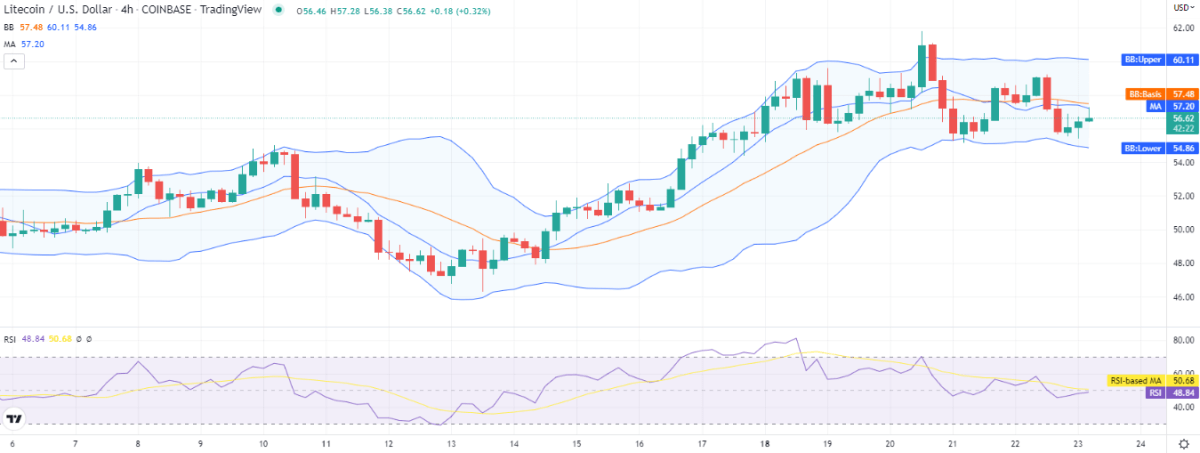
The 4-hour Litecoin price analysis indicates a continuous upwards price movement as the price is now touching $56.62 due to the steady bullish activity of today. But if observed closely, the price has been falling back during the last hour, which, if extended, can change the trend in a bearish direction, which shows the bearish pressure in the market.
 LTC/USD 4-hours price chart. Source: Trading view
The moving average on the 4-hour price chart is present at $57.20, whereas the Bollinger bands average is present at $57.48 above the MA. The increase in volatility has also been observed as the Bollinger bands show signs of divergence. The upper limit of the volatility indicator is at $60, and the lower band is at $54.86. The lower band shows comparatively more downwards movement, whereas the upper band is maintaining its level.
Litecoin price analysis conclusion
The Litecoin price analysis suggests a bullish trend, but the momentum is not solid. The current correction observed on an hourly basis may extend, so we can expect the cryptocurrency to move in any direction from the current price point.
Disclaimer. The information provided is not trading advice. Cryptopolitan.com holds no liability for any investments made based on the information provided on this page. We strongly recommend independent research and/or consultation with a qualified professional before making any investment decisions.