The cryptocurrency market’s volatile motion in terms of price has left a lot of investors and users gaping as the bear run continues to go on. The massive drop has even affected popular cryptocurrencies like Bitcoin [BTC], XRP, Ethereum [ETH] with no reprieve to be seen anywhere near. Tron [TRX], on the other hand, has been on an uphill recently with a massive bullish spike that occurred on February 4.
1 hour:
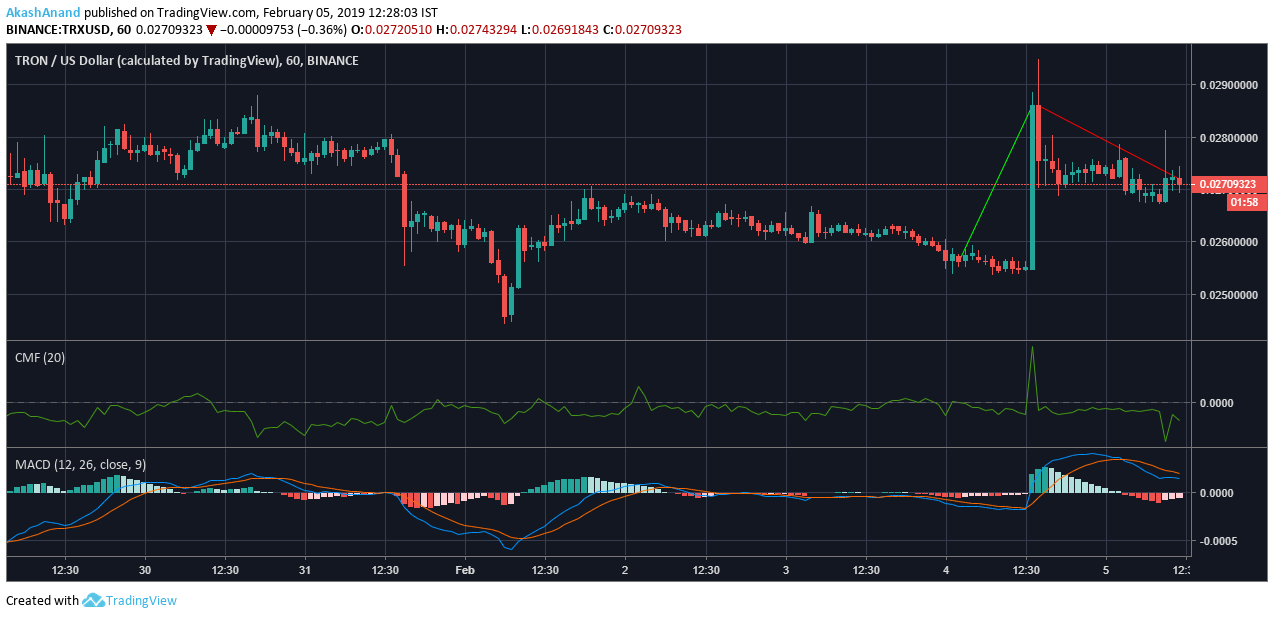
Tron’s one-hour graph is a mix of both bearish and bullish signals with the recent spike evident on the chart. The uptrend lifted the price to $0.0257 to $0.0286 while the following downtrend saw the price fall from $0.0286 to $0.0272. The support has been holding at $0.024 while the resistance is at $0.0286.
The Chaikin Money Flow indicator is below the zero line after a noticeable fluctuation. The hold below the line shows that the capital coming into the market is less than the capital leaving the market.
The MACD indicator is above the histogram after the signal line and the MACD line underwent a bearish crossover. The histogram is again a mix of bearish and bullish signals.
1 day:
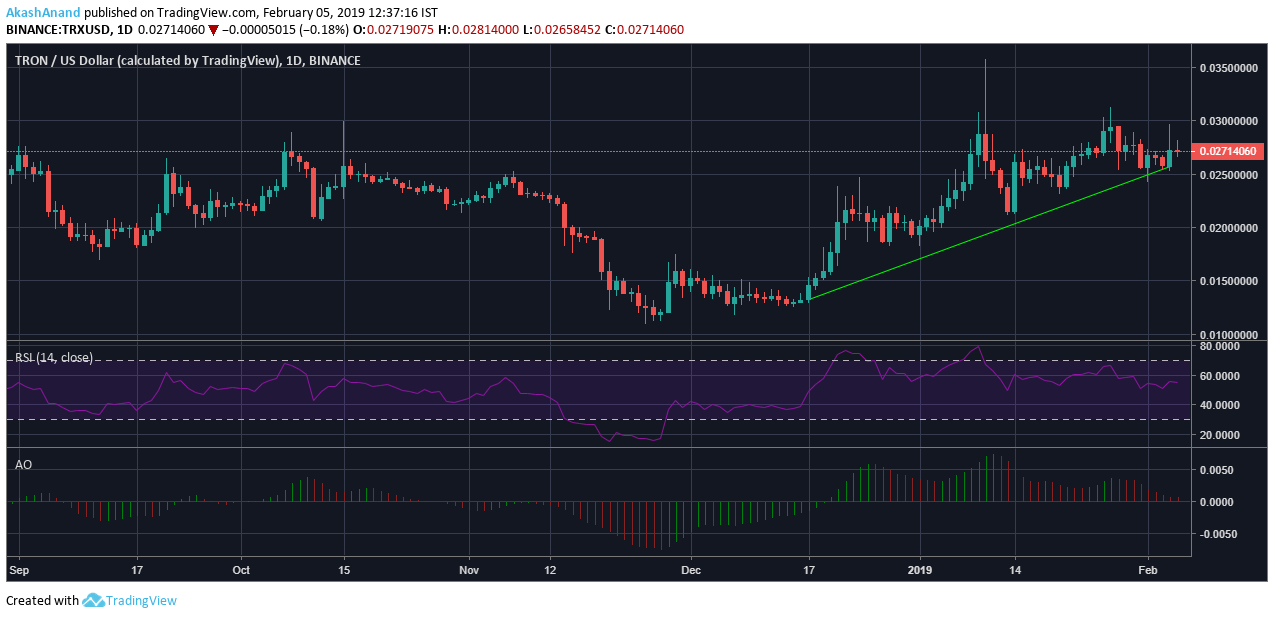
The one-day chart for Tron shows a significant uptrend that boosted the price from $0.0131 to $0.029. The support has been holding at $0.0119.
The Relative Strength Index is closer to the overbought zone after the recent bullish spike. This is a sign of the buying pressure being more than the selling pressure.
The Awesome Oscillator has picked up on the graph which means that the market momentum has increased in the market.
Conclusion:
The above-mentioned indicators paint a picture of a cryptocurrency between the bear’s and the bull’s grip. Tron can still hold on to the silver lining that it has become one of the biggest gainers over the past week.