After beginning the week off with a brief rise to $115 billion, the market cap has since dipped and is stagnating at $113 billion. Bitcoin Cash [BCH] has managed to edge up one spot on the global coin ladder as Tether [USDT] slipped to the seventh position, being overtaken by a rebranded Litecoin [LTC].
Bitcoin Cash has followed the broader market trend and fallen meagrely against the US dollar with a press time decline of 0.26 percent. The market cap of the now fifth largest cryptocurrency in the market is $2.091 billion, just $75 million behind EOS.
In terms of exchange domination, BW takes the top spot with a BCH trade volume of $23.39 million or 10.5 percent in the BCHABC/USDT trading pair. Following up is P2PB2B in the trading pairs BCH/USD, BCH/BTC, and BCH/ETH.
1-hour:
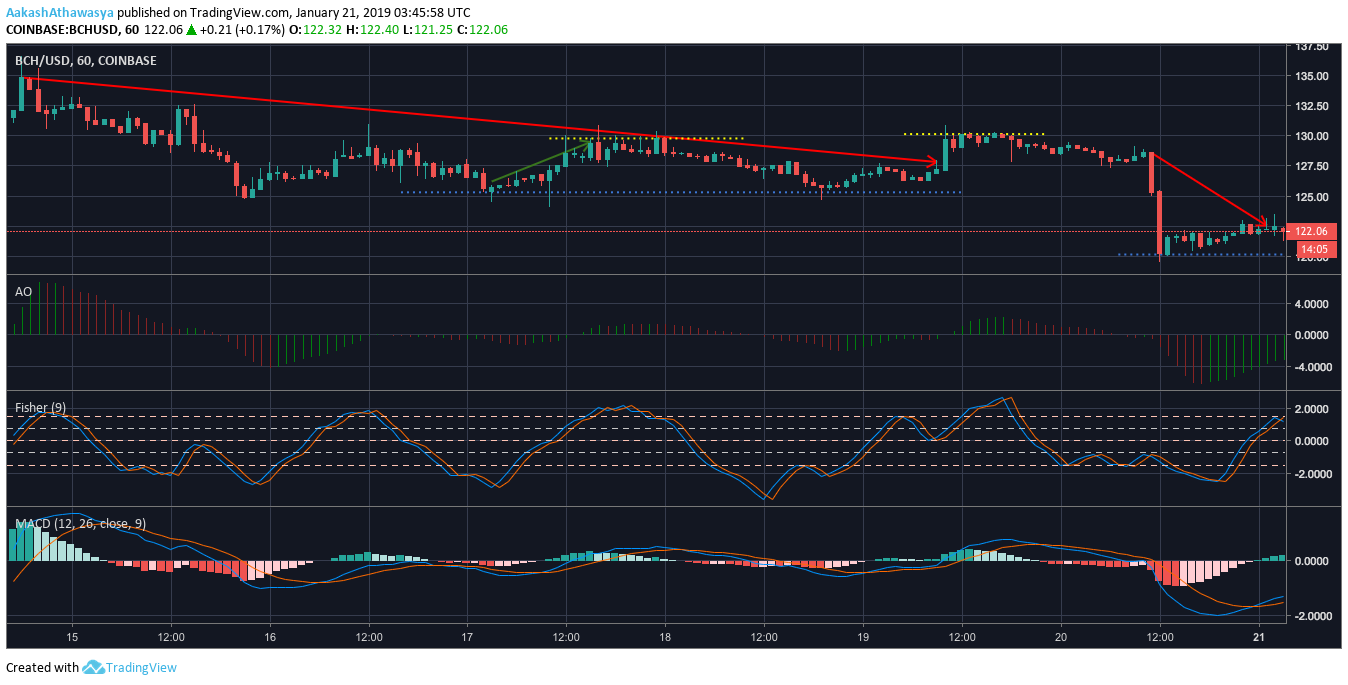
The coin experienced three prominent downtrends, the first from $112.02 to $111.1, the second from $119.03 to $111.9, and the third from $119.07 to $117.4. The coin was pushed up after the first downtrend from $110.6 to $117.43, followed by $115.68 to $119.82.
The immediate support level of the coins is pegged at $115.86, which the coin is just trading above. The immediate resistance level of the coin is placed at $119.96.
The Bollinger Bands point to a decrease in the volatility of the coin, as the mouth of the Band looks to close, with the Moving Average line pointing to a mildly bullish trend.
The Parabolic SAR indicates that the coin is making a switch from a bearish to a bullish swing, with the dotted line converging with the trend line.
The Chaikin Money Flow shows that investors are pulling their money out of BCH as the CMF line is below 0.
1-day:
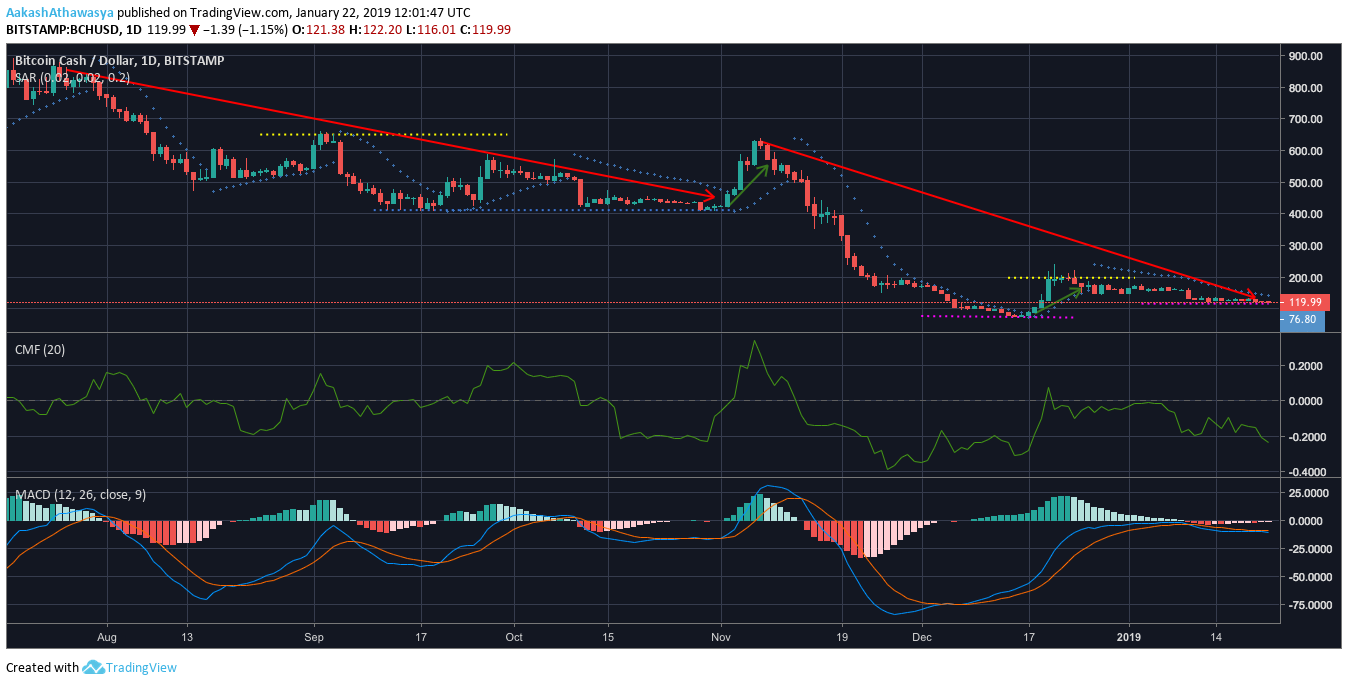
The one-day trend line shows a massive downtrend, induced by the November 2018 hardfork, which the BCH market has not recovered from. The downtrend in question stretched from $621.74 to $134.77. BCH enjoyed a minor uptrend during the close of 2018 from $76.98 to $186.77.
Bitcoin Cash’s immediate support level is placed at $73.46, which the coin has not dipped close to since December of last year. The immediate resistance level of the coin stands at $196.1.
The MACD line suggests that the coin tried to break into a bullish trend during the close of 2018, but was held back by the bears as the collective market declined.
The Relative Strength Index shows that the coin is being off-loaded by the investors as the BCH price looks to dip. At press time, the RSI was recorded at 42.02, slowing moving away from the ‘oversold’ zone.
The Fisher Transform indicator shows that the Fisher line overtook the Trigger line at the beginning of the month, signaling a mildly bullish swing.
Conclusion:
Bitcoin Cash has been reeling since the close of the previous year and the first month of 2019, trying to shake off the hardfork induced bears. The fifth largest crypto began the month of February in good stead, with the price climbing away from support, indicators pointing to a bullish spree and pushing up on the global coin ladder as well.
Short-term indicators point to a bullish swing for the coin while the long-term forecasts point to a more stabilizing run for Bitcoin Cash.