Aave price analysis shows that the price is currently in a bullish trend as it has broken out of the descending triangle formation. The next level of resistance is at$94.90, and if the price can sustain its current momentum, it is likely to test this level in the near future. However, if the price starts to retrace from its current levels, support is likely to be present at$88.89. Overall, the bias is currently bullish for AAVE/USD.
The digital asset has been on a tear in recent times as it surged from $88.89 to $94.90 in the past few days. The bulls have been in control of the market and are currently looking to push the price higher. However, the bears are also starting to show some signs of life and are looking to take control of the market. The market has increased by 1.49 percent in the past 24 hours and is currently trading at $90.23. The 24-hour trading volume is $193 million, and the market capitalization is $5.68 billion.
Aave price analysis on a 1-day price chart: AAVE/USD is facing rejection at $94.90
Aave price analysis on the 1-day price chart shows that the price is currently facing rejection at the $94.90 level. If the price can break out of this level, it is likely to test the $100 level in the near future. The current price surge has taken the prices to the upper limit of the consolidation range and a further move up may take place in the near term as the price is currently trading at the $90.23 mark.
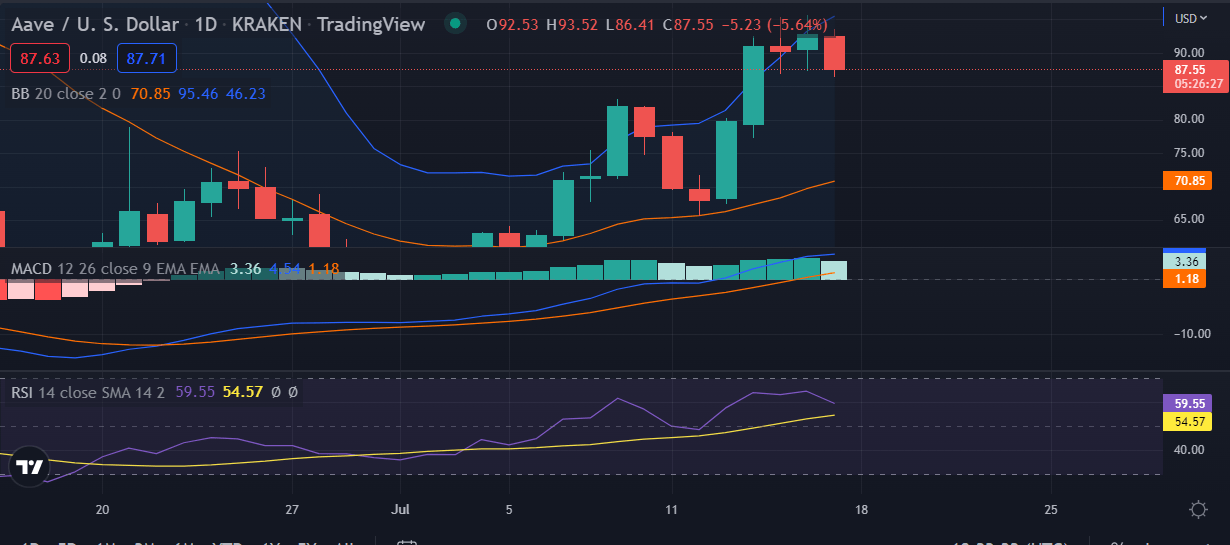
The Bollinger Bands on the 1-day chart for AAVE/USD is widening which shows that the market is volatile. The RSI indicator is currently at 60 which shows that the market is neither overbought nor oversold. The Moving Average Convergence Divergence indicator is bullish as the MACD line is above the signal line.
Aave price analysis on a 4-hour chart: Recent development and further technical indications
Aave price analysis on the 4-hour chart, AAVE/USD is seen trading inside an ascending parallel channel as prices corrected lower after hitting the upper limit of the channel. The current move can be considered a retracement as the prices are still trading inside the bullish channel.
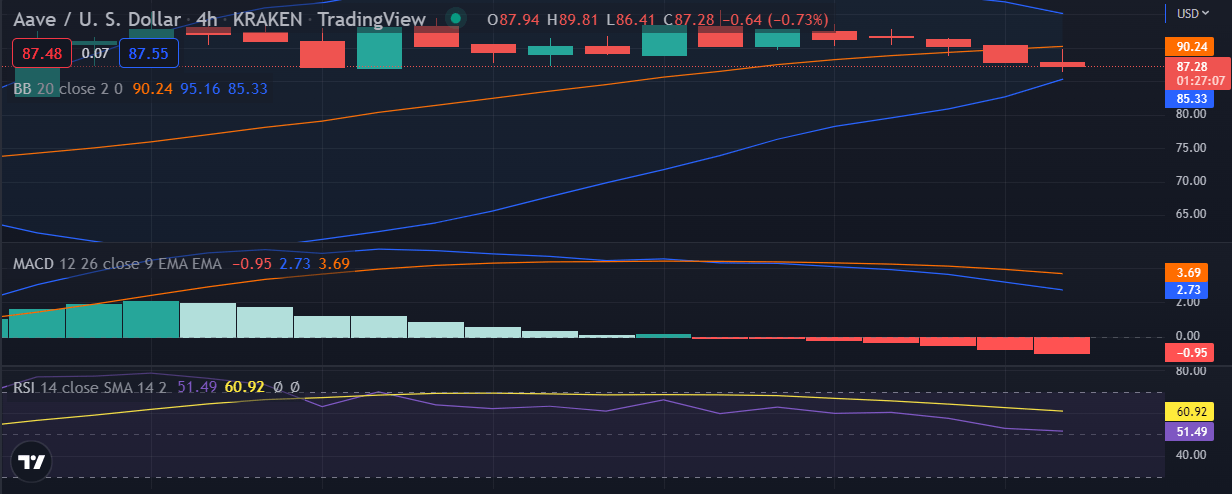
The MACD line is currently at the $90.13 mark and is above the signal line which shows that the market is bullish. The RSI indicator is moving towards the overbought levels which shows that the market is bullish. The Relative Strength Index is currently at 65.65. The Bollinger Bands moving above the price candles which is a sign of bullish momentum in the market.
Aave price analysis conclusion
Aave price analysis concludes that AAVE prices are currently trading in a bullish manner and are likely to move higher in the near term as the bulls remain in control of the market. However, the bears are also starting to show some signs of life and a breakout above the $94.90 level is needed for AAVE/USD to move higher.
Disclaimer. The information provided is not trading advice. Cryptopolitan.com holds no liability for any investments made based on the information provided on this page. We strongly recommend independent research and/or consultation with a qualified professional before making any investment decisions.