Recent Avalanche price analysis shows a bearish trend in the market as the cryptocurrency depreciates towards the $19.10 mark. The AVAX/USD pair is currently facing resistance at the $20.03 level and will need to break above this point to continue its upward movement. However, the bears will likely take control of the market and push the price down to the $18.77 support level. The AVAX/USD pair is currently trading at $19.10 and is down by 1.48 percent on the day. The market cap has also decreased to $2.09 billion, and the 24-hour trading volume is at $449.98 million.
AVAX/USD 1-day price chart: Price sinks down to $19.10
The price is going down once again as a bearish trend has been confirmed from the one-day Avalanche price analysis. AVAX/USD pair is trading hands at $19.10 at the time of writing after being on the decline steadily since yesterday. The market is following a descending channel formation as the price action remains between the two parallel trendlines. The price is expected to continue its downward move and may even break below the $18.77 support level if the selling pressure continues.
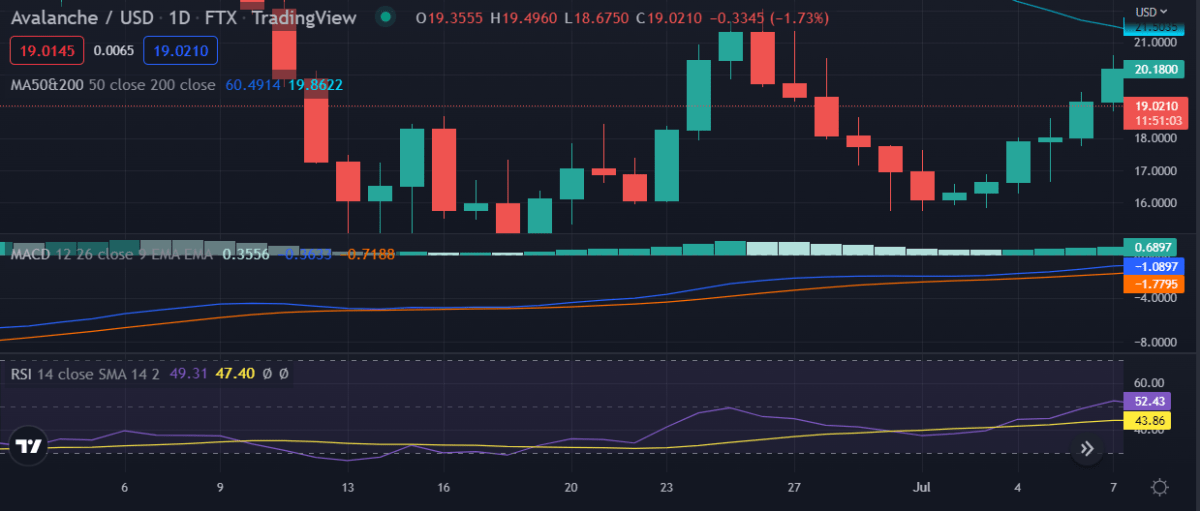 AVAX/USD 1-day price chart. Source: TradingView
The 50-day moving average has crossed below the 200-day moving average, which is a bearish sign for the market. The RSI indicator is also in the oversold region, indicating that the bears are in market control. The MACD indicator has also turned bearish as the signal line has moved above the histogram.
Avalanche price analysis: Recent developments and further technical indications
The 4-hour price chart for Avalanche price analysis shows that the market is in a clear bearish trend. The decreasing volume is also an indication that the market is losing steam and is expected to head lower in the short term. Looking at the other side of the picture, if the bulls can take control of the market, they may push the price up to retest the $20.03 resistance level.
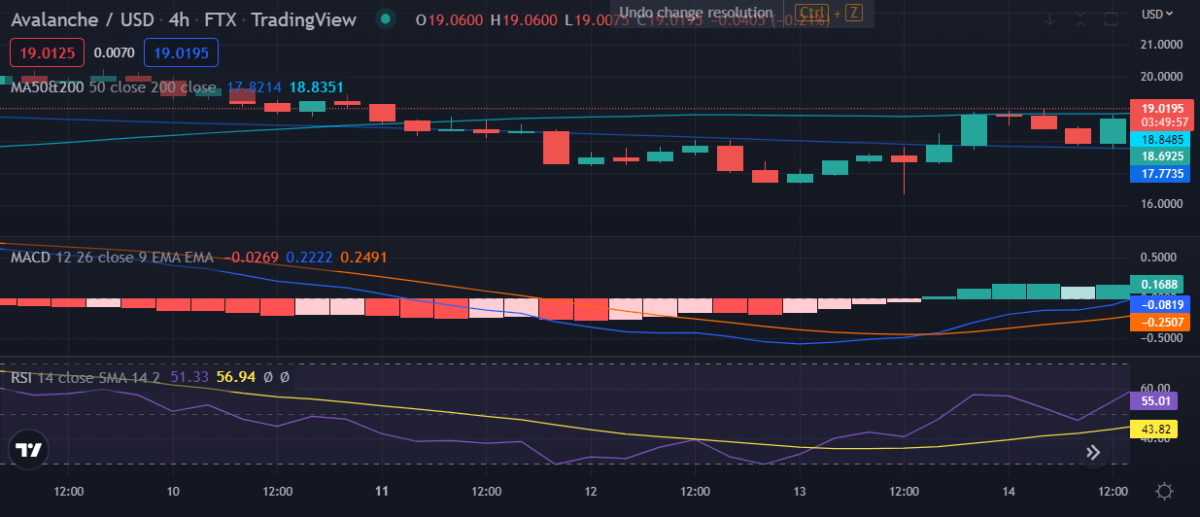 AVAX/USD 4-hours price chart. Source: TradingView
The Moving Average Convergence Divergence (MACD) indicator shows that the signal line is moving above the histogram, which is a bearish sign. The Relative Strength Index (RSI) indicator is below the 50 level, which is another indication that the market is bearish. The 50-day moving average is $20.15, and the 200-day moving average is at $21.06.
Avalanche price analysis conclusion
The price is headed down once again, as it has been confirmed from the one-day and four hours Avalanche price analysis. The price has followed a downward movement today because of the bearish trend dominating the market. The bears were in the driving seat for the past 24 hours, but the bulls may make a comeback if they can take control of the market. Investors should wait for the market to show more clarity before making any further moves.
Disclaimer. The information provided is not trading advice. Cryptopolitan.com holds no liability for any investments made based on the information provided on this page. We strongly recommend independent research and/or consultation with a qualified professional before making any investment decisions.