Polkadot price analysis reveals a relatively upbeat approach today; the price has gained most of its lost value. In the last few days, the cost of DOT has received much positive attention and has increased to a significant degree. On July 14, 2022, the price suddenly increased from $6.09 to $6.70. However, the price started to gain further positive momentum on the same day and regained a value of as much as $6.76. On July 15, 2022, the price saw massive highs and reached an all-day high of $6.92. However, the currency price of the cryptocurrency remains around $6.87.
Polkadot trades at $6.87 right now; Polkadot is up 8.36% in the last 24 hours, with a trading volume of $377,745,704 and a live market cap of $6,779,737,186. Polkadot ranks at #12 in the cryptocurrency.
DOT/USD 4-hour price analysis: Recent updates
Polkadot price analysis reveals the market volatility to follow an uncertain opening movement, which causes the DOT prices to become more susceptible to volatile change. As a result, the Bollinger’s band’s upper limit is $6.89, acting as the support point for DOT. Conversely, the lower limit of the Bollinger’s band is at $6.14, representing the strongest support of DOT.
The DOT/USD crosses over the Moving Average curve indicating a bullish movement in the market. Furthermore, due to the recent breakout, the price appears to move upwards with a strong possibility of retracing the resistance. The breakout has caused the volatility to increase as well significantly.
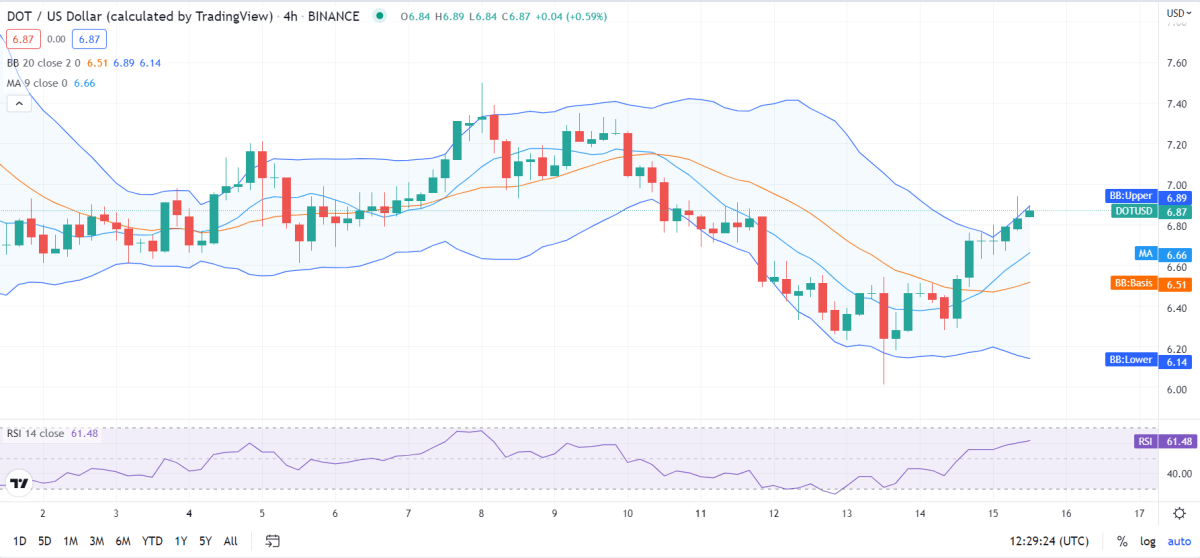
Polkadot price analysis reveals the Relative Strength Index (RSI) score to be 61, which falls in the upper-neutral region. The RSI score follows an upward movement in the overvaluation region, signifying future inflation. The DOT/USD price has found a stable place within the market and has anchored itself there. The dominance of buying activity causes the RSI to increase.
Polkadot price analysis for 1-day
Polkadot price analysis reveals the market volatility to enter a slight downward movement; it’s beginning to decline as the resistance and support bands move closer. The cryptocurrency price will follow the volatility and become less susceptible to volatile change. The Bollinger’s band’s upper limit is $7.72, acting as the strongest resistance for DOT. The lower limit of the Bollinger’s band is present at $6.23, representing the strongest support of DOT.
The DOT/USD price appears to cross over the Moving Average curve signifying a bullish movement. The price moves upward towards positive dynamics. It seems that the bulls have claimed the market for themselves and are on their way to maintaining this dominion for the next few weeks. The price is anchored in a safe place, and the volatility bands don’t seem to pose a threat to the bulls; if they play their cards right, they might end up with a long-term regime.
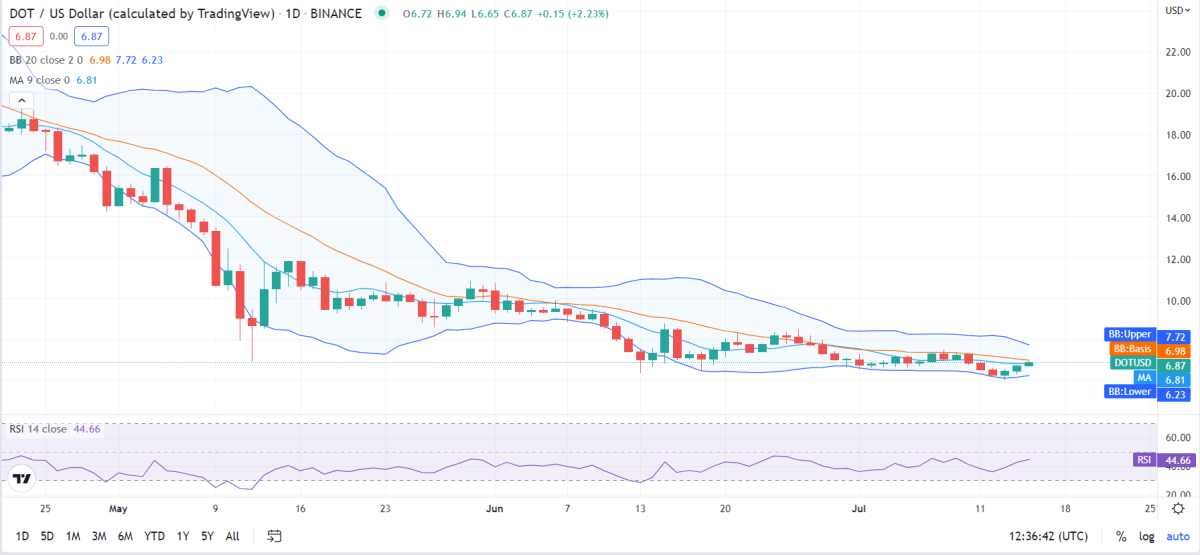
Polkadot price analysis reveals the Relative Strength Index (RSI) to be 44, indicating that the cryptocurrency is stable. Polkadot falls in the lower-neutral region. However, its position is bound to change as the RSI score follows an upward movement indicating dominant buying activity.
Polkadot Price Analysis Conclusion
Polkadot price analysis concludes that the cryptocurrency packs massive potential for positive movement; however, for now, the market is stuck and expected to break, which might cause hindrances in the way of bulls.
Disclaimer. The information provided is not trading advice. Cryptopolitan.com holds no liability for any investments made based on the information provided on this page. We strongly recommend independent research and/or consultation with a qualified professional before making any investment decisions.