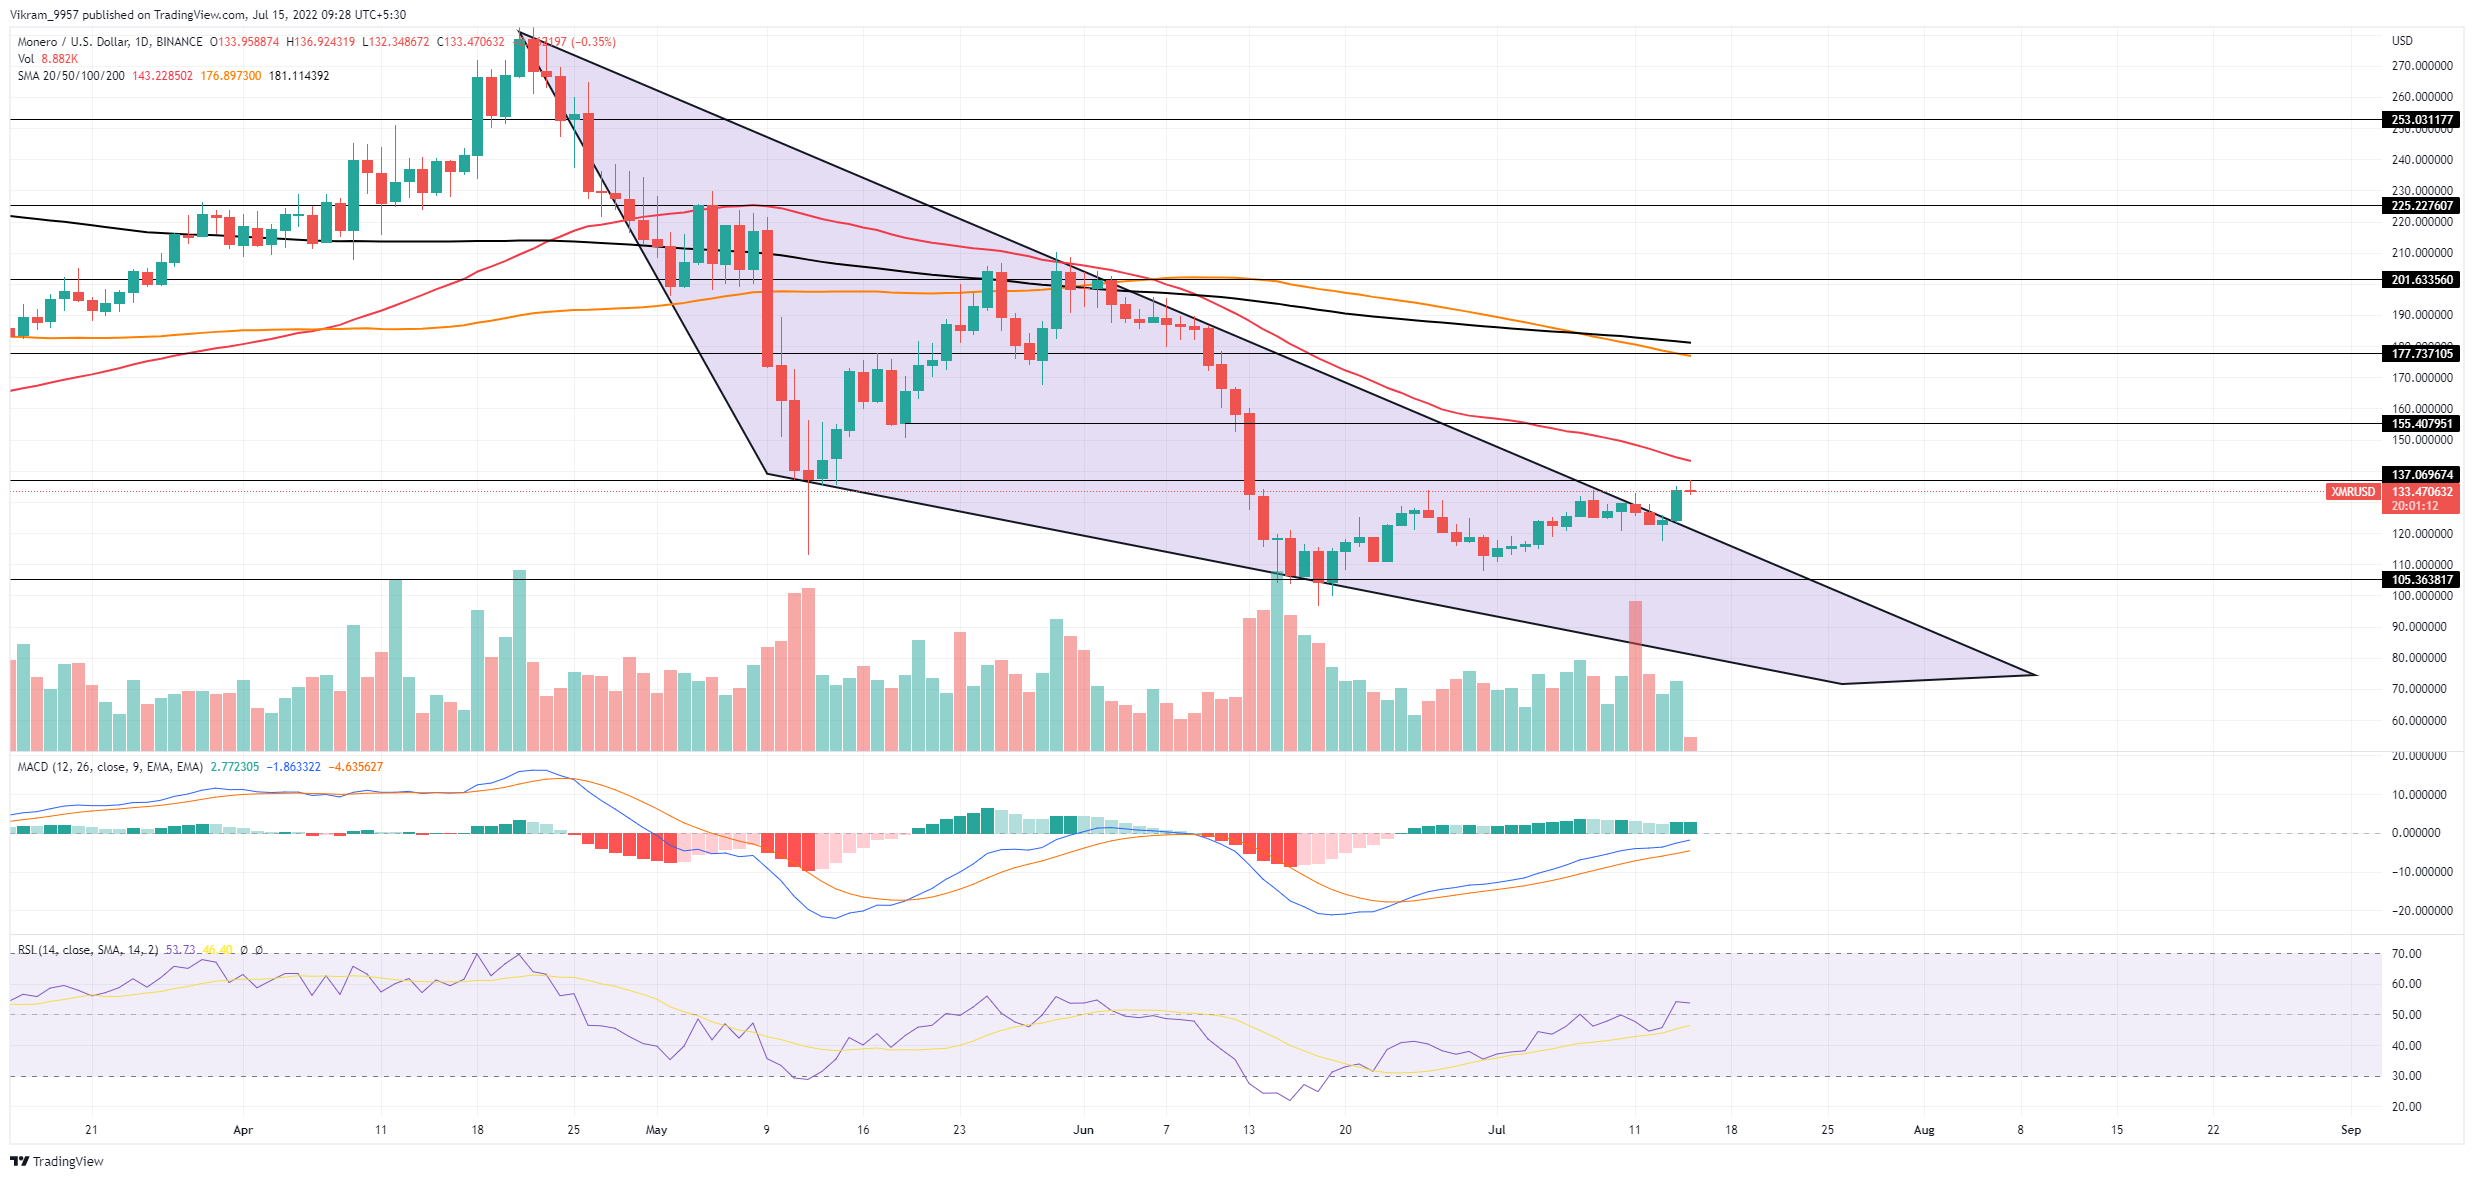
XMR technical analysis shows a bullish continuation challenging the overhead resistance at $137 after surpassing a highly bearish trendline.
Key Technical Points:
- XMR prices have increased by 7.06% in the last 24 hours.
- The market price takes a bullish exit from the falling wedge pattern in the daily chart.
- The 24-hour trading volume of Monero is $104 Million, indicating a rise of 17%.
Past Performance of XMR
As mentioned in our previous analysis, the XMR price action displays the falling wedge pattern in the daily chart. The bearish pattern accounts for a 60% drop this summer, testing the psychological mark of $100. However, the buyers quickly regained the train control resulting in a price jump of more than 30% to take the bullish exit of the falling wedge.  Source - Tradingview
XMR Technical Analysis
The XMR breakout rally struggles to surpass the $137 resistance level teasing a potential retest of the broken trendline. Hence, traders buying at the current market price can put a stop loss below the $120 support level. The MACD indicator shows a continuous growth in buying pressure as the fast and slow lines prepare to cross the zero line. Therefore, the likelihood of a bullish continuation increases, which may further increase demand. The RSI indicator shows a rising trend in the underlying bullishness, breaching the halfway line. Hence the technical indicator supports the possibility of a price jump above $137. Coming to the SMAs, the 50-day SMA prepares to oppose the bullish growth at $140. Meanwhile, the bearish crossover of the 100 and 200-day SMA projects a selling signal. In a nutshell, XMR technical analysis maintains an overall optimistic point of view for the upcoming trend except for the SMAs.
Upcoming Trend
If the increased buying pressure fuels the breakout rally above the 50-day SMA, traders can expect the XMR market value to reach $150. Conversely, a reversal from $137 prices may retest the broken trendline. Resistance Levels: $137 and $150 Support Levels: $120 and $100
 cryptoknowmics.com