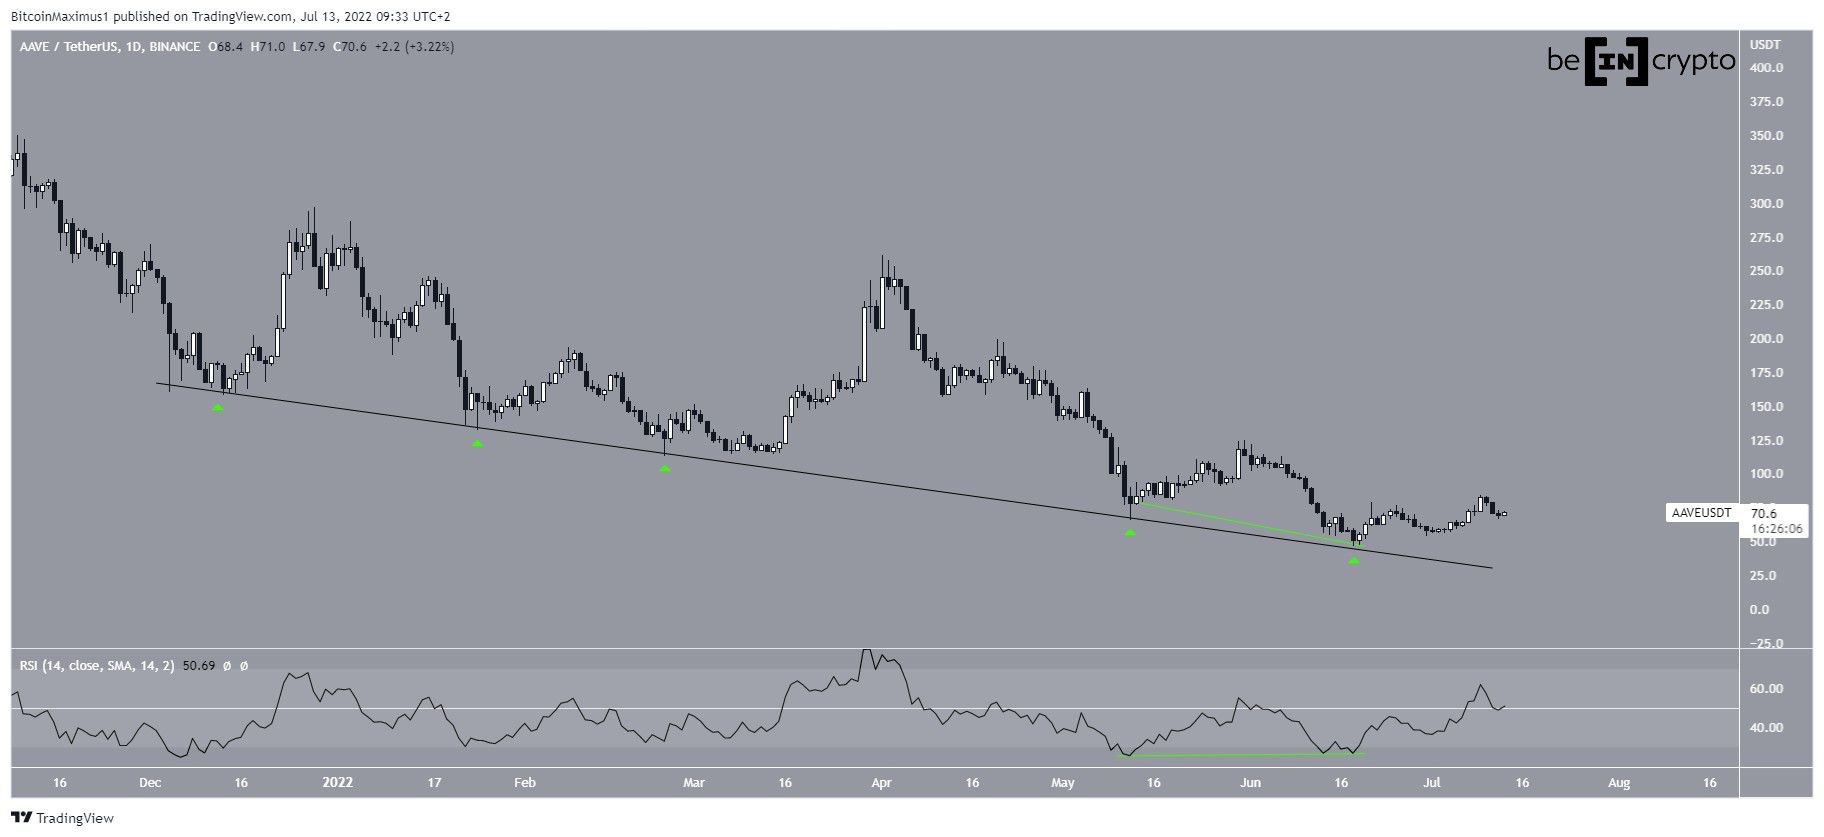
Aave (AAVE) has been increasing since bouncing at a descending support line on June 18. However, it has yet to confirm a potential bullish trend reversal.
AAVE has been falling alongside a descending support line since Dec. So far, the line has been validated five times (green icons).
During the two most recent touches on May 12 and June 16, the daily RSI generated a very significant bullish divergence (green line). This led to an ongoing short-term bullish reversal. Since then, the daily RSI has moved above 50 in what is considered a sign of a bullish trend.
Short-term movement
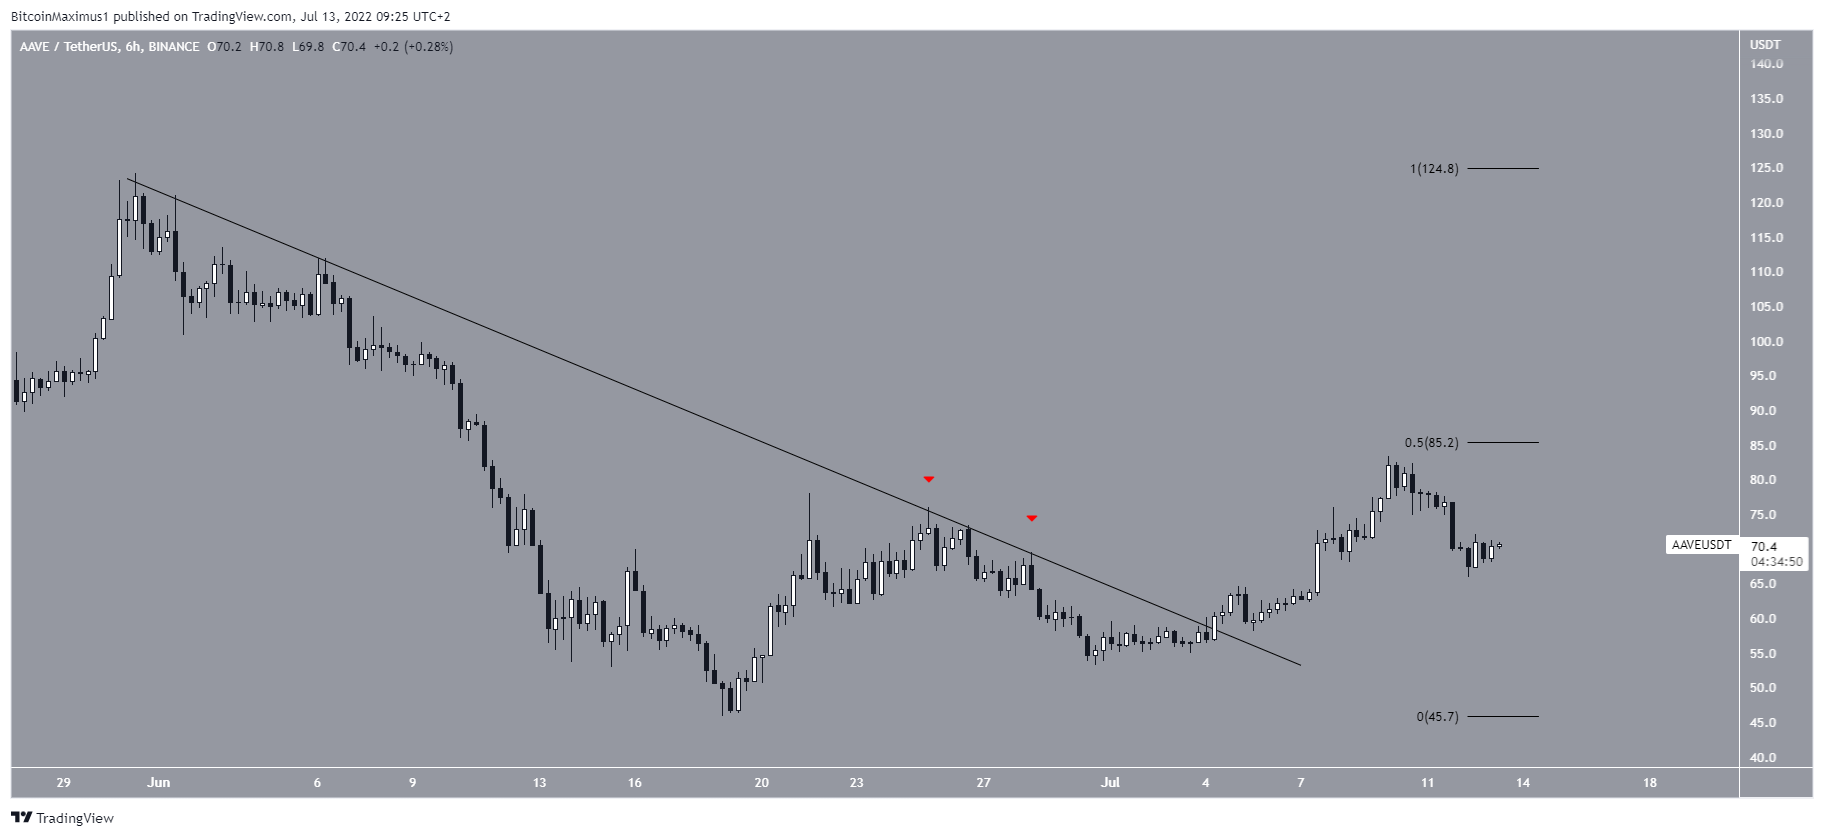
The six-hour chart shows that the price had been falling below a descending resistance line since the beginning of June. After the June 18 reversal, the price made two unsuccessful breakout attempts (red icon). It finally broke out on July 4.
The breakout led to a high of $83.20, but the price was rejected by the 0.5 Fib retracement resistance level and has been falling since.
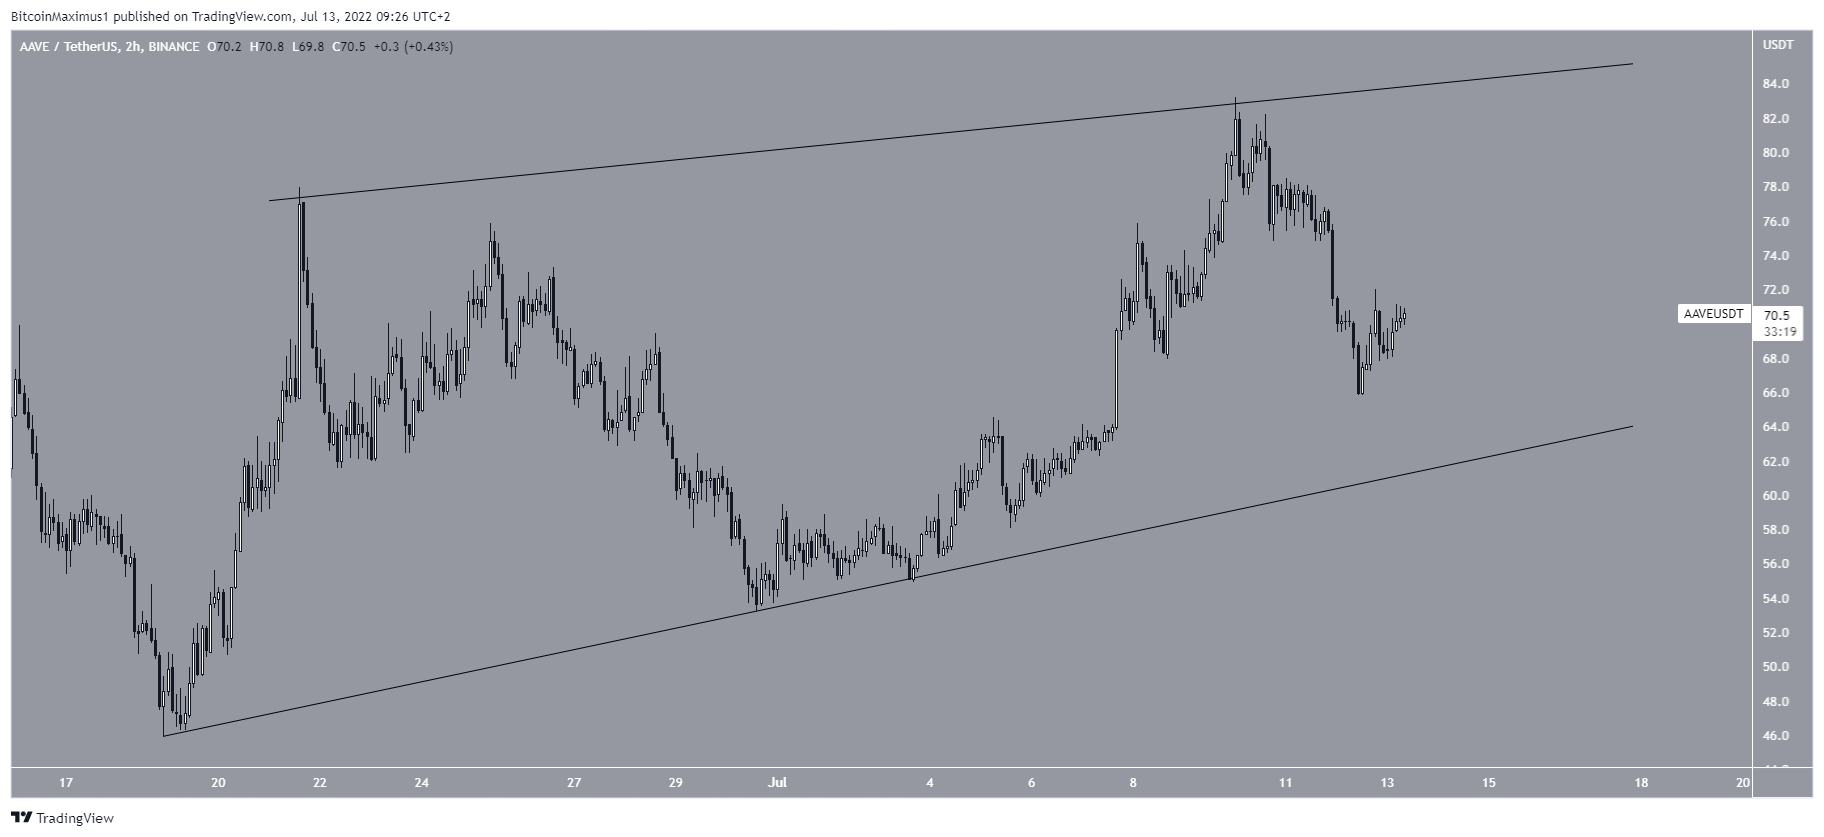
The two-hour chart shows that since the aforementioned June 18 bottom, the price has been trading inside an ascending wedge. The wedge is considered a bearish pattern, meaning that an eventual breakdown from it would be expected.
So, the six- and the two-hour charts provide conflicting signs due to the breakout from a resistance line and presence of a bearish pattern.
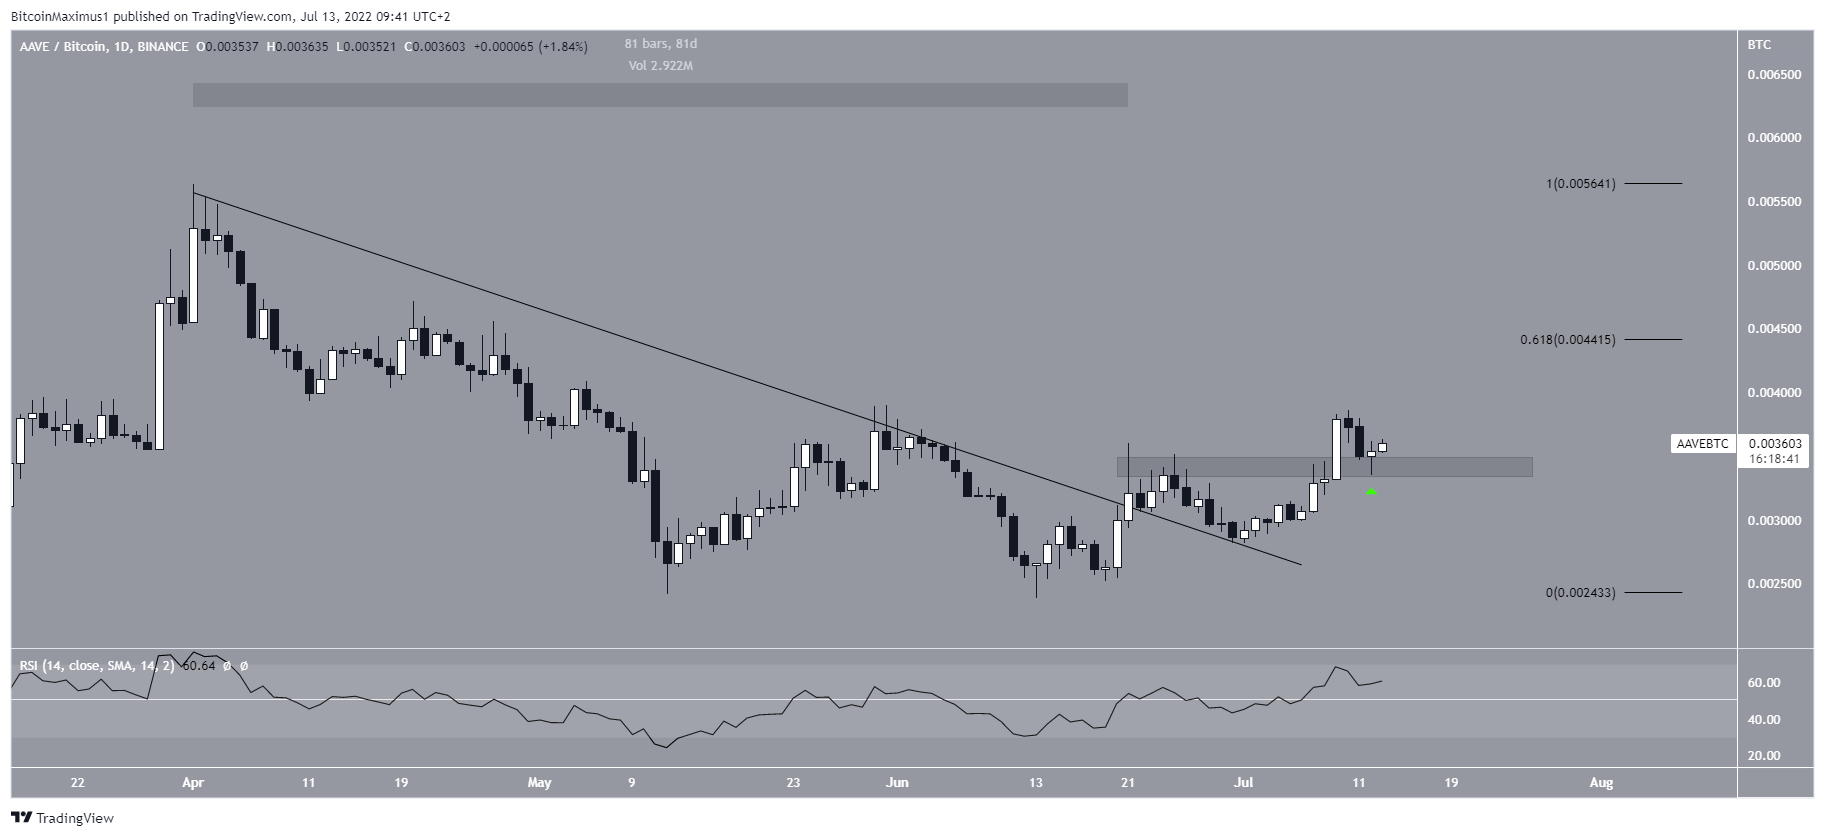
AAVE/BTC
The AAVE/BTC movement is very similar to its USD counterpart, but slightly more bullish. The main reason for this is that the price has broken from a longer-term descending resistance line, which had previously been in place for 81 days. Additionally, it has reclaimed the ₿0.0034 horizontal area and validated it as support (green icon).
Furthermore, the daily RSI is above 50, supporting the continuation of the upward movement. If the increase does continues, the next closest resistance would be at ₿0.0034, created by the 0.618 Fib retracement resistance level.
For Be[in]Crypto’s previous bitcoin (BTC) analysis, click here.