Uniswap price analysis remains bearish today, following from yesterday’s massive 16 percent decline that took price down to $5.25 support. UNI declined more than 2 percent over the past 24 hours to as low as $5.36 with trading volume rising above 55 percent. Uniswap price took a sudden correction on July 10, 2022, after facing rejection at the $6.38 resistance point and is now set for a bearish crossover. Price could find an uptrend if buyers come into the market at discounted price over the current trend, but would need to look out for the high volatility currently in place. UNI market cap fell around 3 percent today, moving down to $4,195,369,658.
The larger cryptocurrency market continued to decline sharply from yesterday, as Bitcoin receded down below the crucial $20,000 mark with a 4 percent decline. Ethereum lost 7 percent in price to stay just above $1,000, while major Altcoins showed similar downtrends. Cardano dropped 4 percent to $0.43, whereas Ripple dropped 3 percent to $0.31. Dogecoin dropped down to $0.06 with an almost 5 percent dip, while Solana showed a similar decline to move down to $33.88. Meanwhile, Polkadot moved down to $6.78, dropping 2 percent over 24 hours.
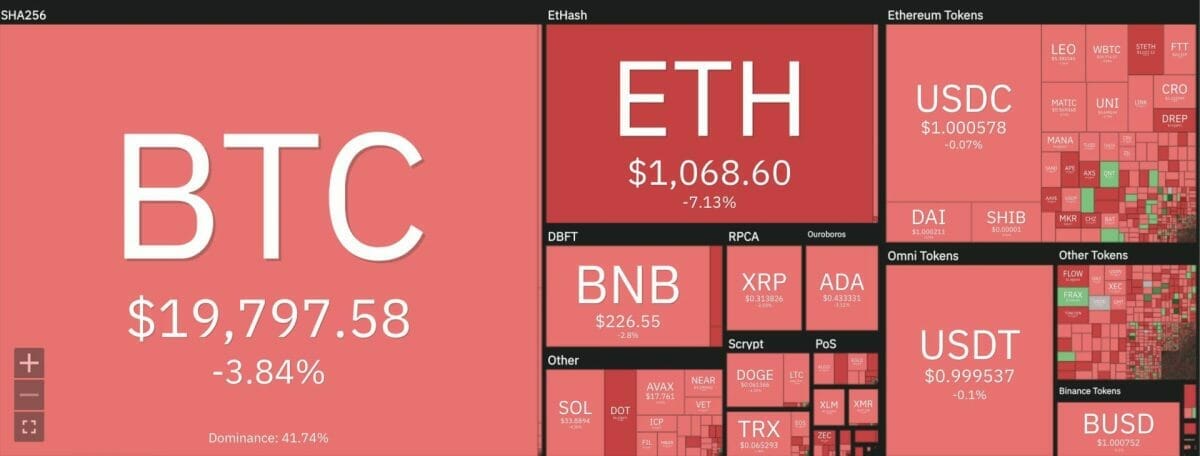 Uniswap price analysis: Cryptocurrency heat map. Source: Coin360
Uniswap price analysis: UNI lines up bearish divergence on 24-hour chart
On the 24-hour candlestick chart for Uniswap price analysis, price can be seen making a sudden shift in momentum on July 10, 2022 after an extended period of upward movement. In the recent uptrend, price rose from lows of $4.64 to rise up to resistance at $6.38, ultimately facing rejection at this point. Price had stayed clear of the 9 and 21-day moving averages till yesterday, and has now fallen below the crucial 50-day exponential moving average (EMA) at $5.68. For a revisit of recent heights, this level will need to be well cleared on the daily chart.
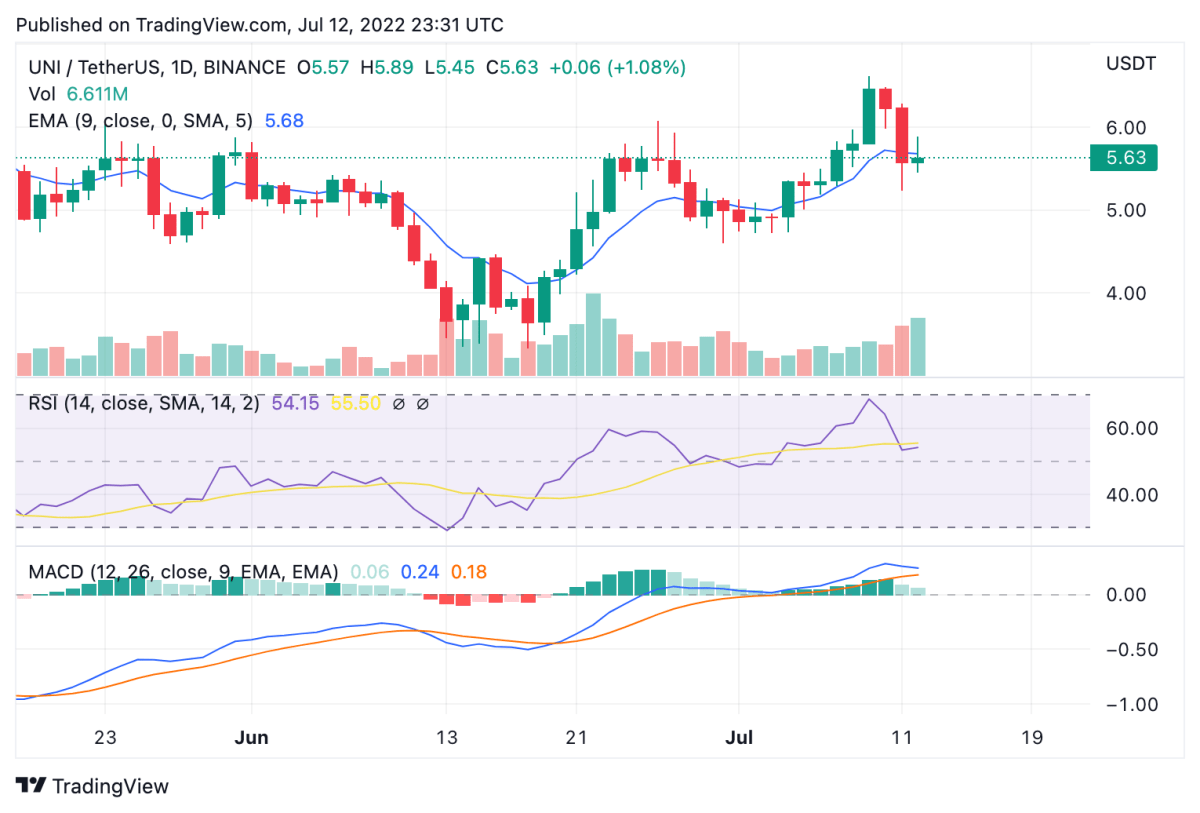 Uniswap price analysis: 24-hour chart. Source: Trading View
Furthermore, the 24-hour relative strength index (RSI) can be seen showing a significant dip in market valuation after falling from the oversold zone at 68.41 to current value at 53.90. Coupled by the 55 percent loss in trading volume, it shows a saturated market for UNI that will need price to bottom further before making an uptrend. Moreover, the moving average convergence divergence (MACD) curve still lies above the neutral zone, but can be seen forming lower highs in attempts to make a bearish divergence.
Disclaimer. The information provided is not trading advice. Cryptopolitan.com holds no liability for any investments made based on the information provided on this page. We strongly recommend independent research and/or consultation with a qualified professional before making any investment decisions.