Bitcoin (BTC) has bounced at the $31,400 horizontal support area while Ethereum (ETH) has bounced at the $2,000 support area.
XRP (XRP) has rebounded from the support line of a descending parallel channel. It has yet to reclaim any crucial horizontal resistance levels.
Monero (XMR) has broken down from a symmetrical triangle pattern.
Kava.io (KAVA) is attempting to break out from a descending parallel channel.
Ethereum Classic (ETC) has broken out from a descending resistance line.
Waves (WAVES) has bounced at a long-term ascending support line.
BTC
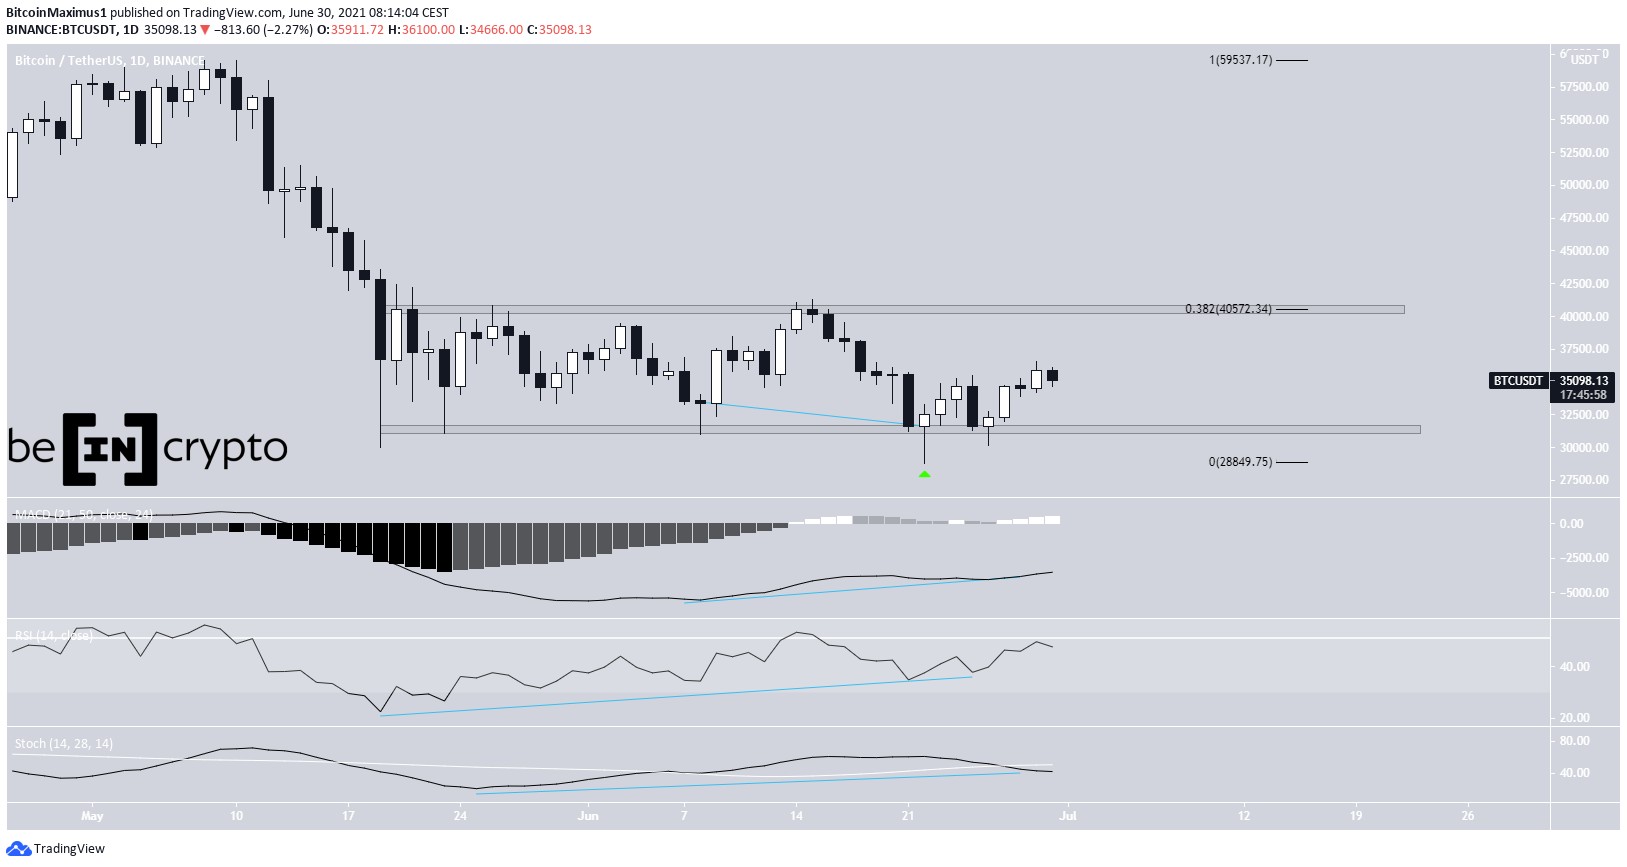
BTC has been moving upwards since June 22. At this time it reached a low of $28,805 and bounced, creating a long lower wick in the process. The move caused a reclamation of the $31,400 horizontal support area.
While the bounce was preceded by significant bullish divergence in the MACD, RSI, and Stochastic oscillator, neither of the indicators have a bullish reading.
In addition to this, it’s possible that the wave count is still bearish.
The main resistance area is found at $40,570.
ETH
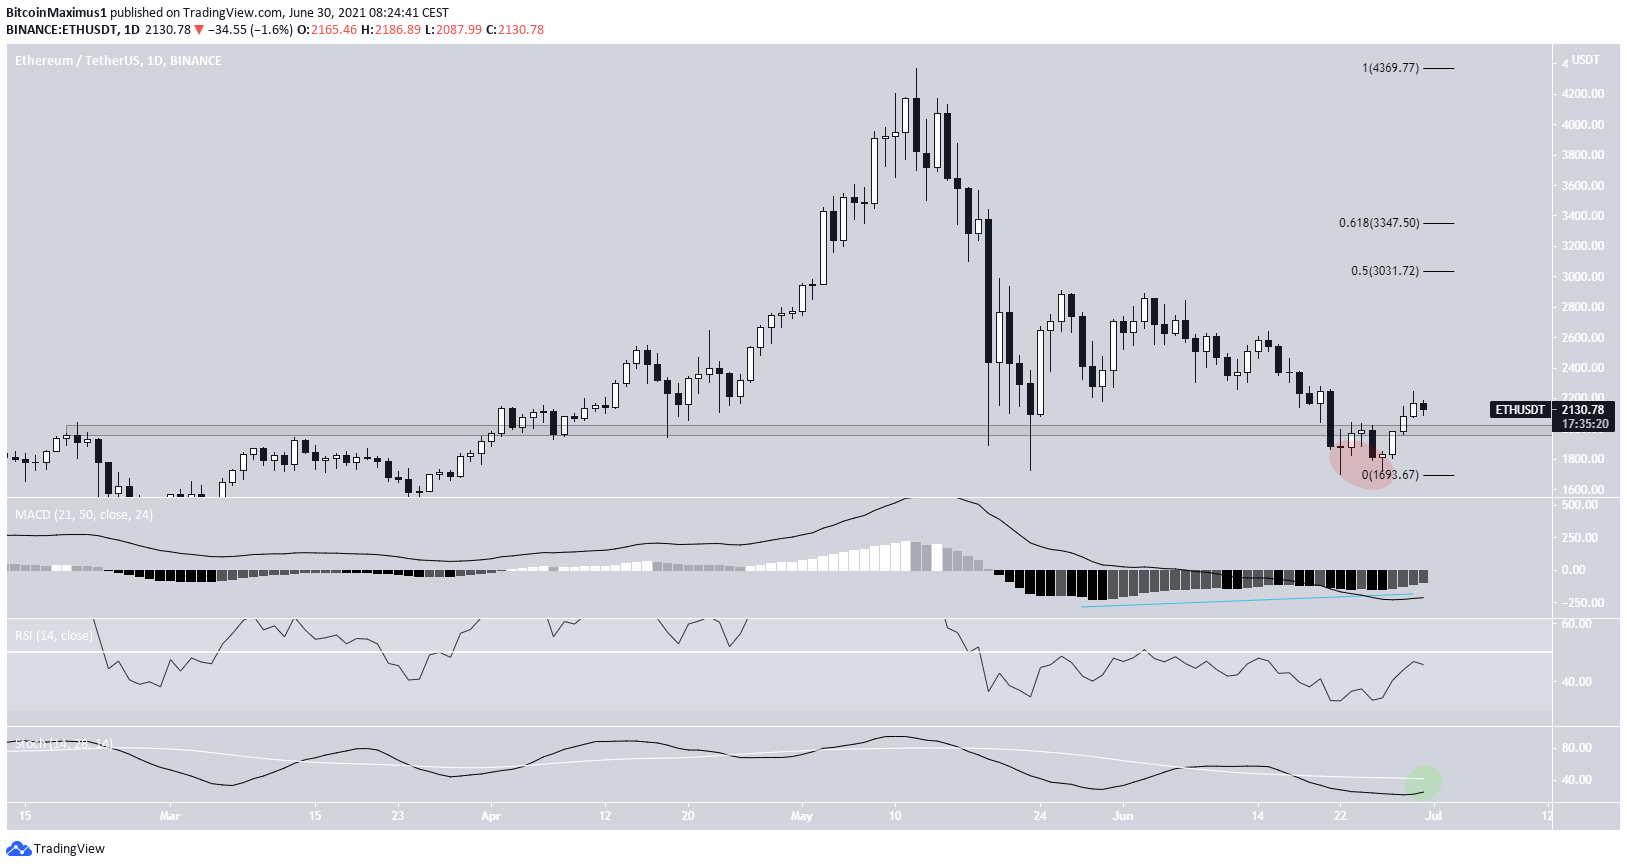
ETH has been trading above the $2,000 horizontal support area since the beginning of April. It fell below this level on June 22-26, reaching a low of $1,700 in the process.
However, it has since reclaimed the horizontal support area, rendering the previous downward movement just a deviation (red circle).
While the bounce was preceded by a bullish divergence in the MACD, technical indicators have not turned bullish yet. The RSI is still below 50 and the Stochastic oscillator has not made a bullish cross. These have to occur for the trend to be considered bullish.
The closest resistance areas are found at $3,030 and $3,350. These targets are the 0.5-0.618 Fib retracement resistance levels.
XRP
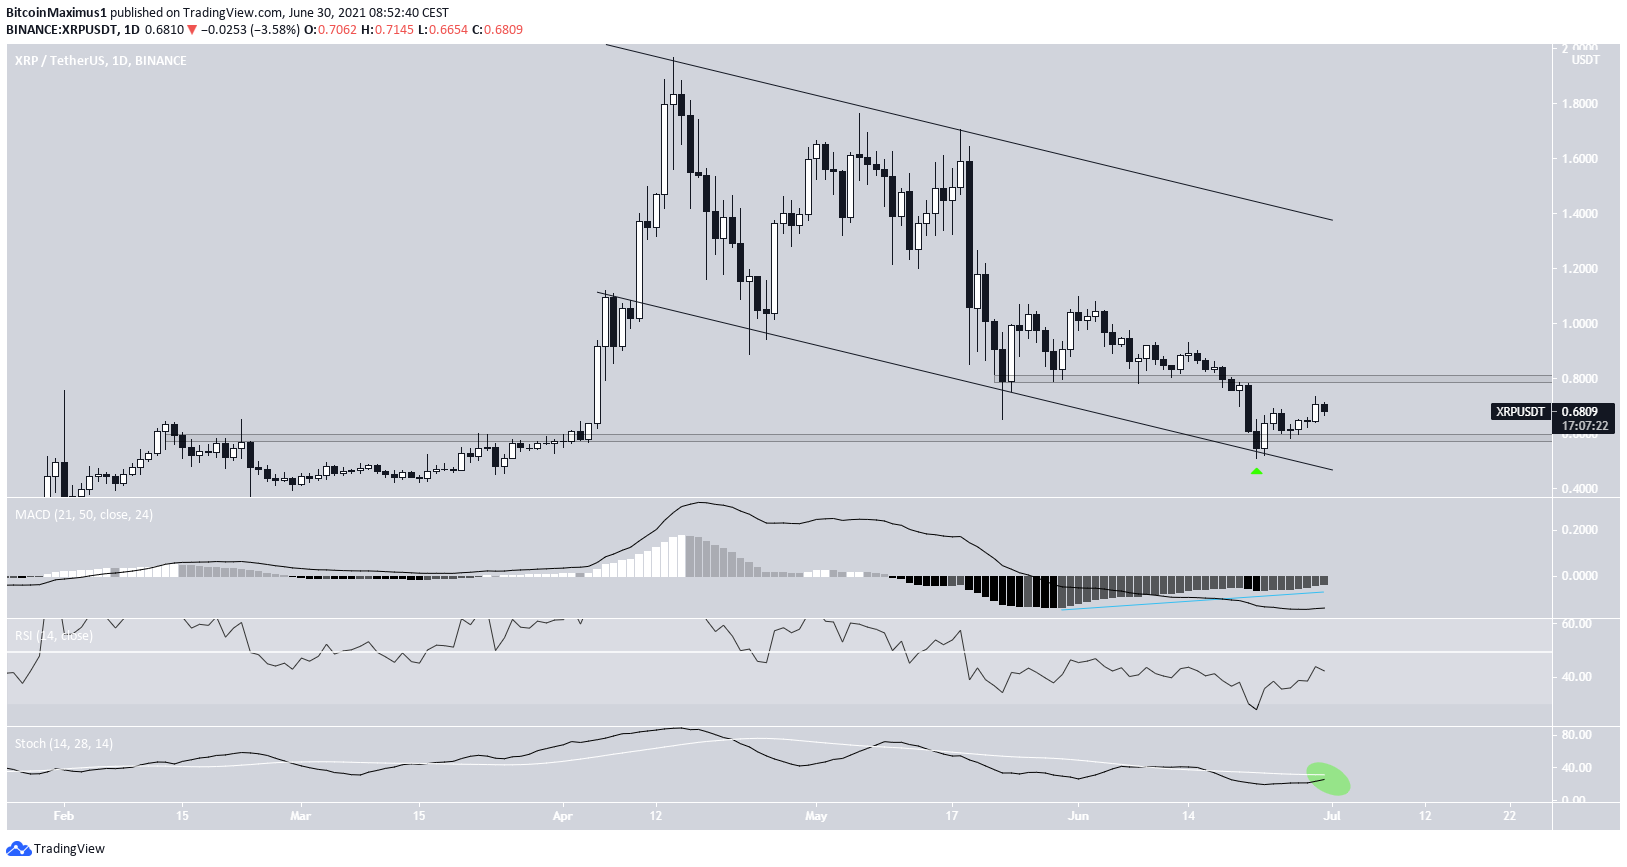
XRP has been decreasing alongside a descending parallel channel since April 14. It reached the support line of the channel for the third time on June 22 and bounced immediately after (green icon). The level also coincides with the horizontal $0.58 support area.
Technical indicators are not yet bullish. Despite the bullish divergence in the MACD, the Stochastic oscillator has yet to make a bullish cross and the RSI is still below 50.
The next closest resistance area is at $0.80.
XMR
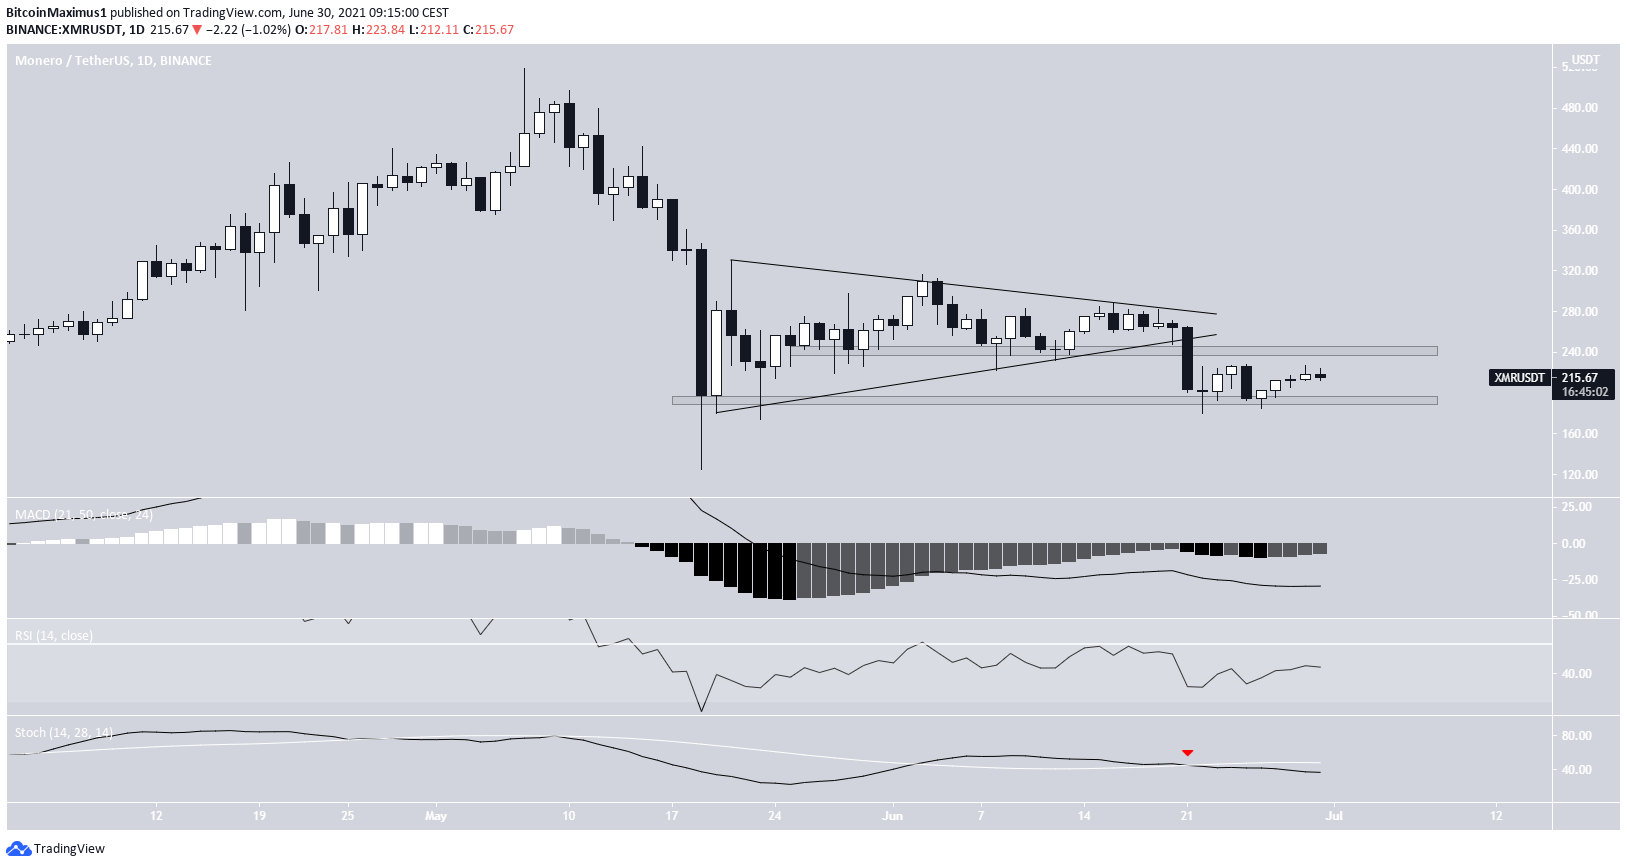
XMR has been increasing inside a symmetrical triangle since bouncing on May 19.
However, it broke down from the pattern on June 21 and proceeded to find support at the $190 horizontal support area.
Despite the ongoing bounce, technical indicators are bearish. The Stochastic oscillator has made a bearish cross (red icon), the MACD is negative, and the RSI is below 50.
The closest resistance area is found at $240.
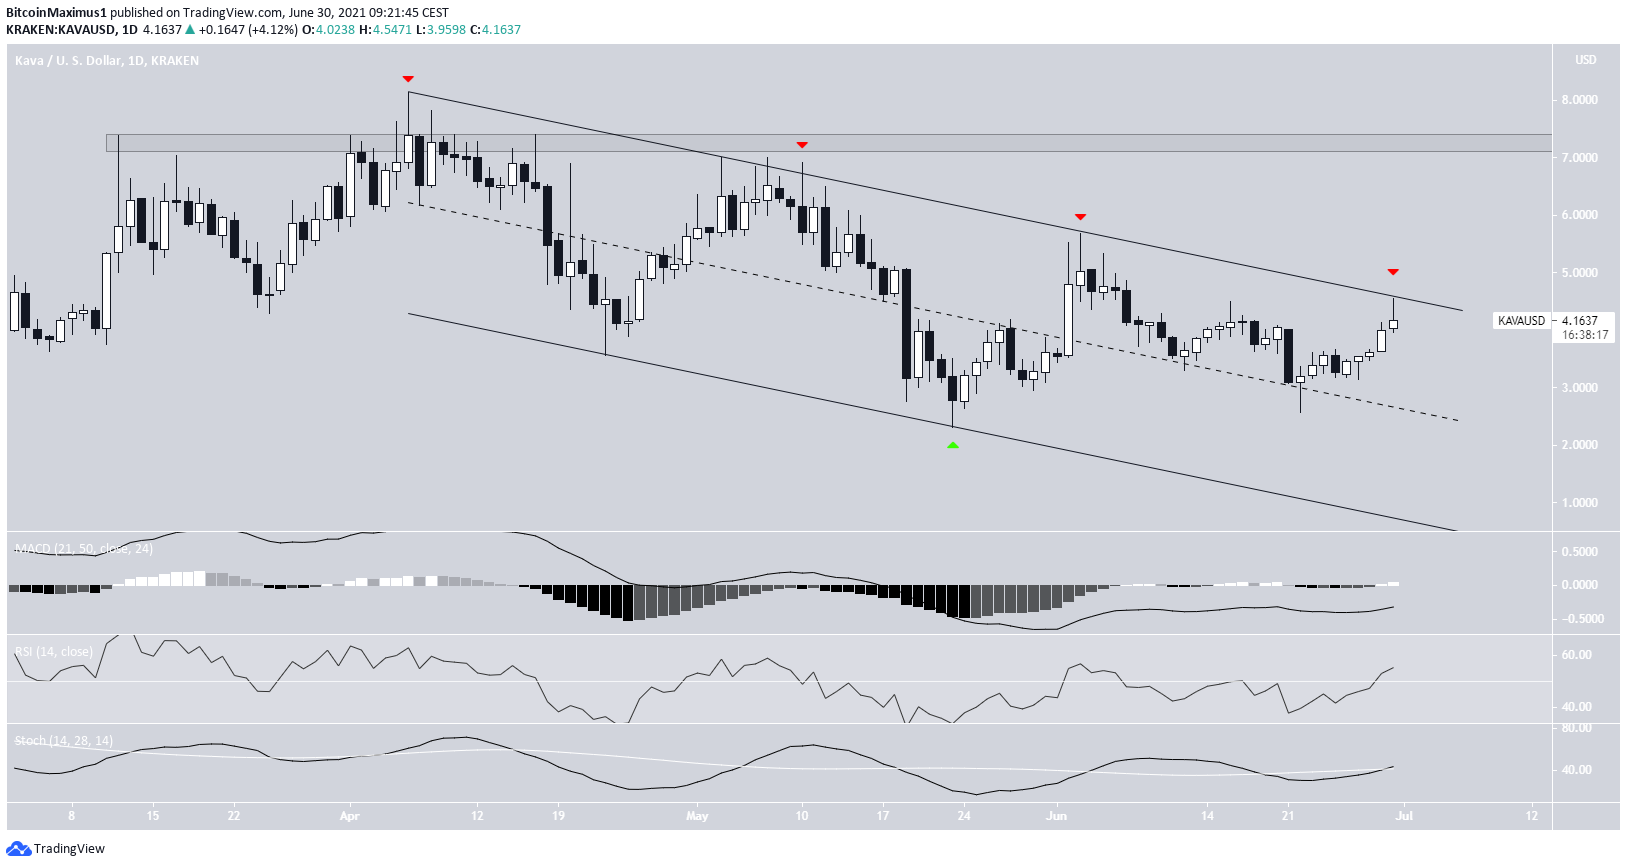
KAVA
KAVA has been decreasing inside a descending parallel channel since April 26. It began the current upward movement on May 23 (green icon) and has now reached the resistance line of the channel. This is the fourth time it has done so (red icons).
Technical indicators are bullish, supporting the possibility that KAVA will break out.
If a breakout occurs, the price could increase all the way to the next resistance at $7.25.
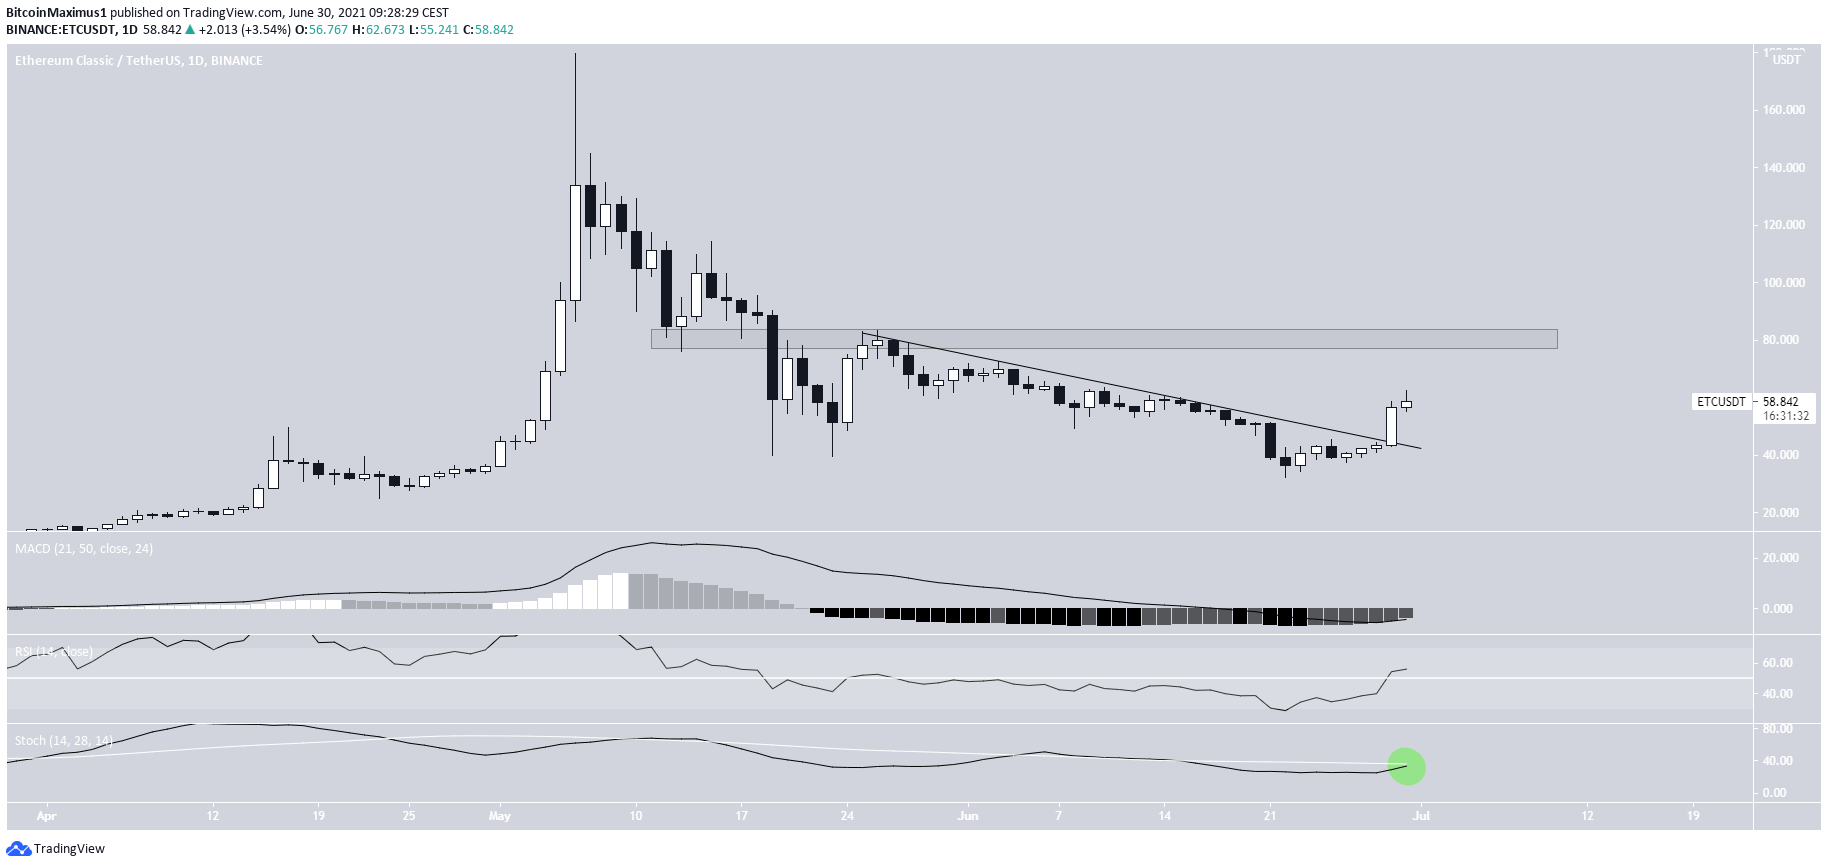
ETC
On June 22, ETC reached a low of $32.11, creating what looks like a double bottom pattern. Shortly after, it broke out from a descending resistance line.
So far, it has managed to reach a local high of $62.67.
Technical indicators are bullish, supporting the continuation of the upward movement.
The next closest resistance area is found at $80.
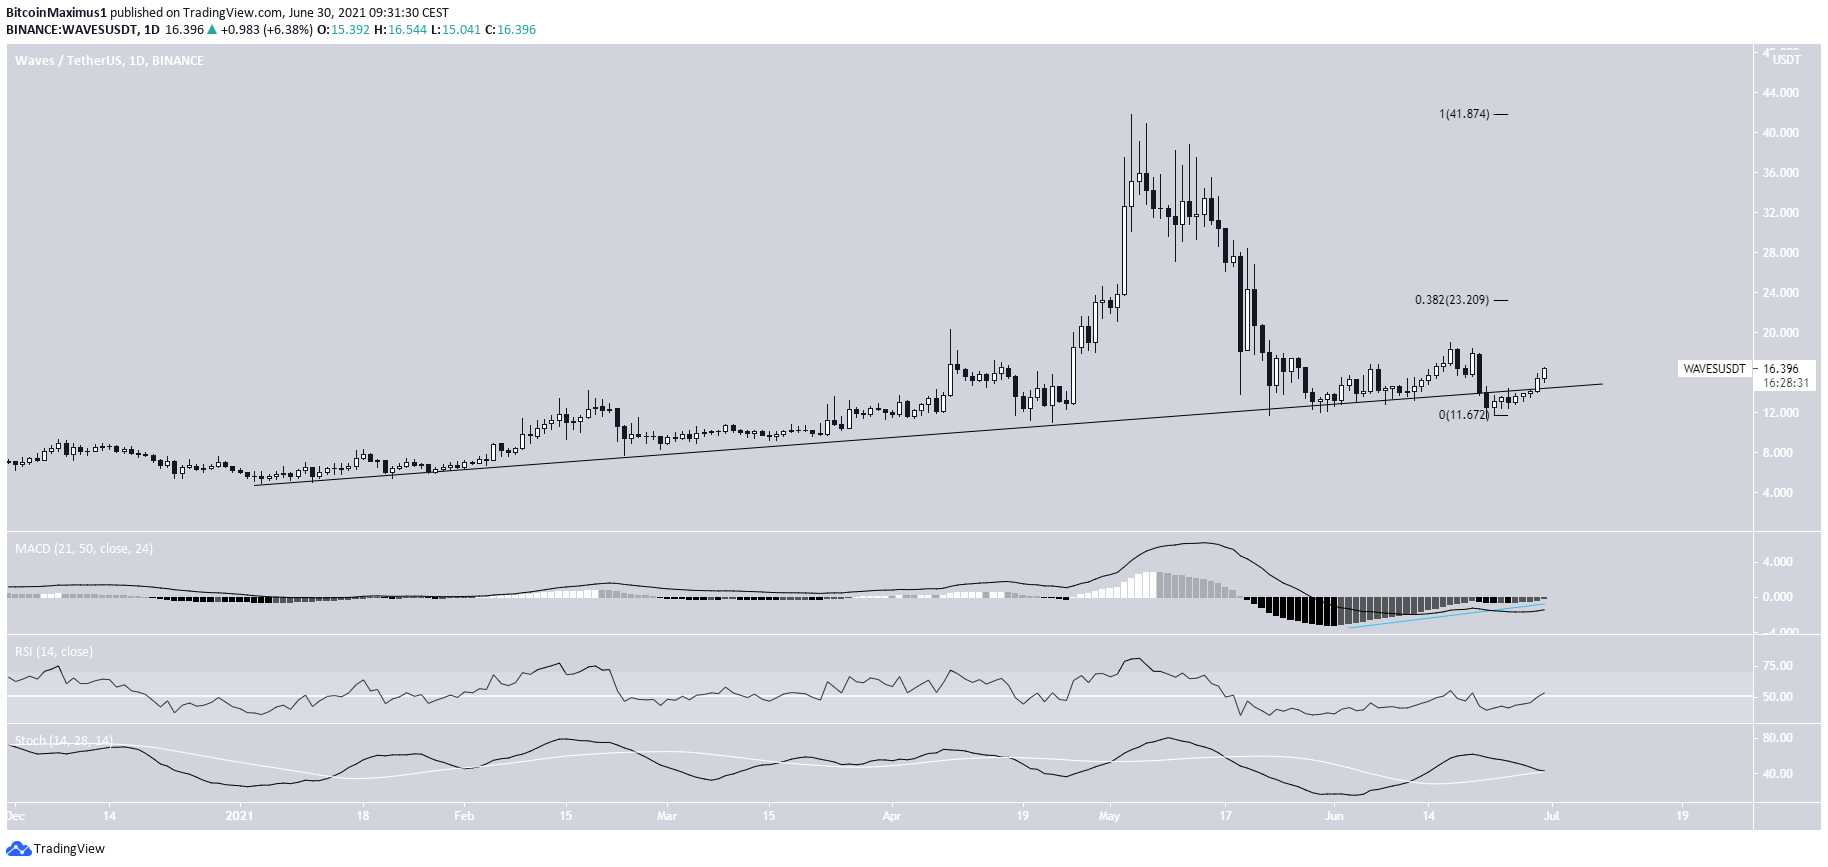
WAVES
WAVES has been trading above an ascending support line since the beginning of May. So far, it has bounced three times above it.
On June 23, it appeared to have broken down but reclaimed the line shortly after.
Technical indicators are providing some bullish signs, such as the bullish divergence in the MACD. However, this alone isn’t enough to confirm the reversal.
The closest resistance area is at $23.20.
For BeInCrypto’s latest bitcoin (BTC) analysis, click here.