Chainlink price analysis shows that LINK prices are currently in a bearish trend as the market trades at $6.40. However, there is some support present at this level, which may provide some relief to the bears. However, if the price breaks below this support, it may fall to $6.38. On the other hand, if the bulls manage to push the prices above $6.80, they may retest the resistance at $7.02. The market opened today at $7.08 and fell to its current $6.40. We can see that the price has made two lower highs and two lower lows, which confirms the bearish trend.
Chainlink price analysis on a daily chart: Bears heighten pressure as prices find support at $6.38
The daily Chainlink price analysis shows that the price has decreased by over 1 percent in the last 24 hours. The market cap now stands at $2,979,518,305, and the 24-hour trading volume is at $433,251,568. We can see that the price has made a new low at $6.38 and found some support at this level.
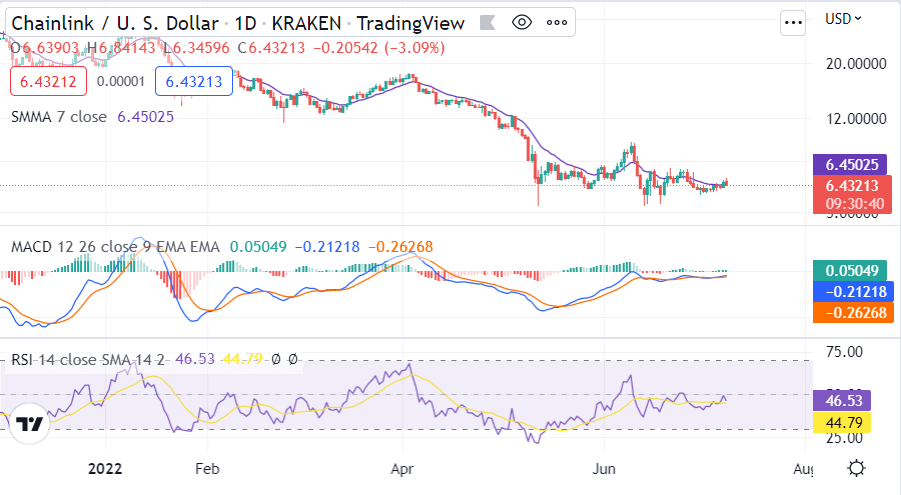 LINK/USD 1-day price chart. Source: TradingView
The MACD shows that the market is in a bearish trend as the MACD line has crossed below the signal line. The current bearish trend will likely continue in the near term as 50-day and 200-day SMA currently stand at $6.79 and $7.21 respectively. The Relative Strength Index is presently at 37.66, which indicates that the market is in oversold territory.
Chainlink price analysis: Recent developments and further technical indications
In the last 4-hours, Chainlink‘s price analysis reveals that the prices have been following a declining trendline. The bulls were in control of the market for the last 4-hours as evident from the candlesticks. The market has been trading between $6.38 and $6.80 but is currently facing rejection at $6.80 as per the 4-hour Chainlink price analysis. Meanwhile, the bears seem to be in control of the market as they push prices towards the $6 level.
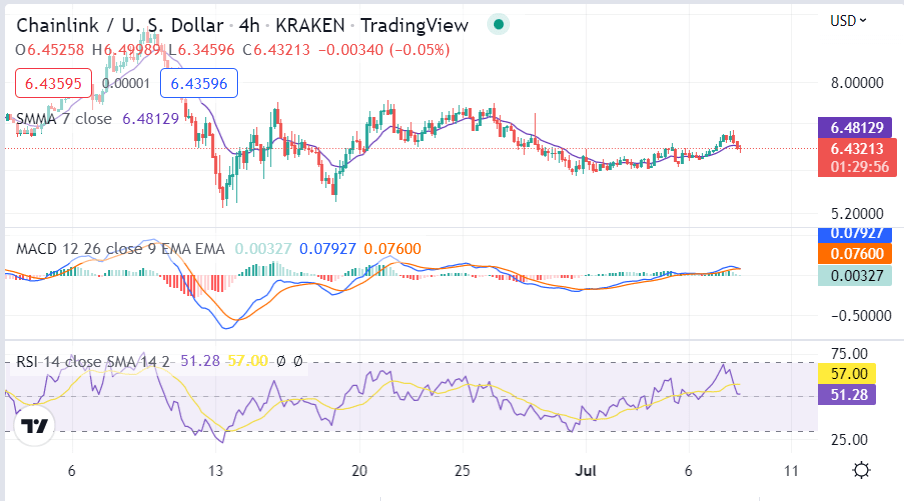 LINK/USD 4-hours price chart. Source: TradingView
The RSI indicator is below the 40-level, which indicates that the market is in oversold conditions. The momentum indicators are currently giving bearish signals as the MACD line has crossed below the signal line, and the 50-4-hour SMA has crossed below the 200-4-hour SMA
Chainlink price analysis conclusion
Chainlink price analysis reveals the cryptocurrency to follow a strong downwards trend with much more room for bearish activity. However, the bears have currently taken over the market, and the declining volatility favors the bears. As a result, they are likely to push prices towards $6 in the near term. However, if the bulls manage to take control of the market, we may see prices retesting the resistance levels at the $7.02 level.
Disclaimer. The information provided is not trading advice. Cryptopolitan.com holds no liability for any investments made based on the information provided on this page. We strongly recommend independent research and/or consultation with a qualified professional before making any investment decisions.