Chainlink price analysis has seen the bulls return above the $6.00 mark. The resistance level for the currency is at $6.41, but a break above this point is expected to lead to movement towards the $6.60 and $6.80 levels in the near term. On the other hand, support is established at $6.22, and a break below this point might lead to a sell-off toward the $5.94 and $5.80 levels. At press time, Chainlink's price was $6.58, up by around 3% in the previous 24 hours as the digital asset has a market capitalization of over $2 billion and just under $288 million in trading volume. Link has been making progress in its price recovery, even though the bulls have yet to regain the $6.00 level and are now targeting a move toward the $7.00 level in the near term. Before it can reach its goal, Link is expected to go through some consolidation at these levels
ChainLink 1-Day Price Chart: Bulls Recover Price up to $6.38
The market's volatility is apparent in the 1-day Chainlink technical analysis, which ranges between $6.22 and $6.41 over a trading range of roughly 24 hours. The price was pushed down by an earlier downward wave, but the bulls were able to propel it up when it found support at $6.22 later on. 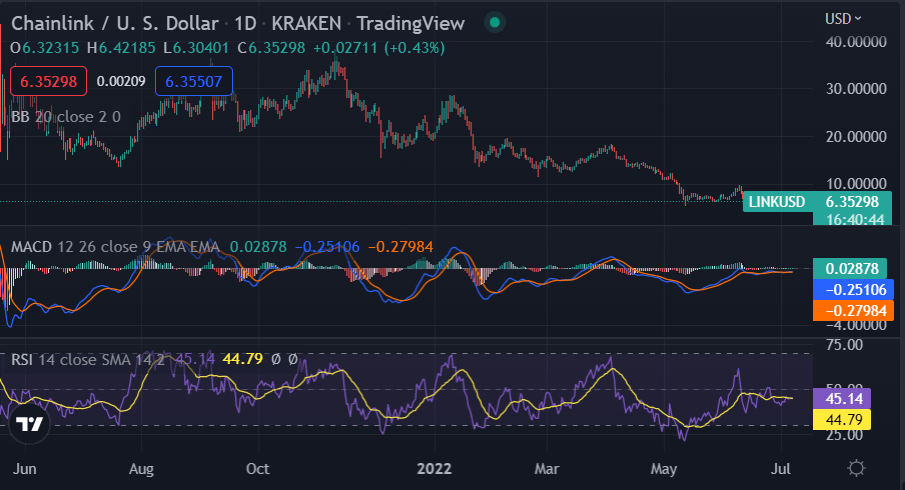 Source: TradingView The MACD indicates increasing bullish momentum as the signal line surpasses the MACD line. The upper Bollinger Band limit on the said time frame has expanded, implying that the market will soon enter a consolidation phase while the lower Bollinger Band limit is near $6.22, which suggests a possible breakout opportunity for longs. The RSI indicator is well above 50, which indicates that the market has a lot of momentum going in its favor.
Chainlink Technical Analysis on the 4-Hour Price Chart
The 4-hour Chainlink price chart indicates that the price follows an ascending channel pattern, with higher highs and higher lows. The digital asset is trading considerably above the $6.22 support level and is presently confronted by resistance near $6.41. The bears may attempt to push the price down once again, but the $6.22 support level is expected to provide significant buying interest in the market. 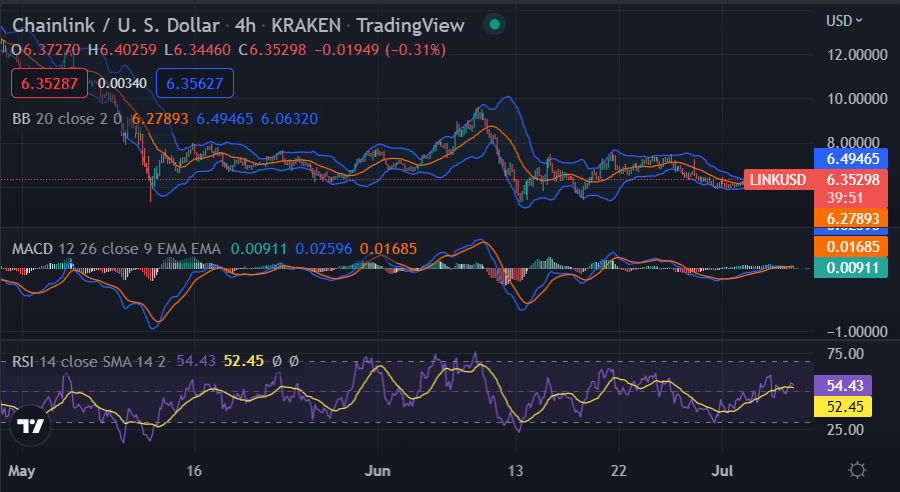 Source: TradingView The volatility is rising as well, which points to positive market movements in the near future. The upper edge of the Bollinger bands has also expanded, suggesting that the market will soon undergo a consolidation phase while the lower edge of the Bollinger bands is close to $6.22 support. The RSI indicator is currently above 60, indicating that the market is overbought. The MACD signal line has also advanced above the MACD line in the 4-hour timeframe, suggesting that the market is becoming more bullish.
Conclusion
The Chainlink price chart shows a strong upward climb, with plenty of room for additional growth. The bulls have taken control of the market at present, and the declining volatility is on their side, suggesting that they may raise LINK's price significantly in the near term and reach $7.00.