Solana price analysis indicates that the asset is presently in an upward trend. However, it has encountered resistance at the $36.87 mark. There is strong support for the coin at the $32.76 level. The value of Solana is currently trading above $35 and appears to be on its way up in the near future. SOL is up by nearly 3% in the last day and is currently trading at $35.65. The coin's market capitalization is $12,065,545,692, with a 24-hour trading volume of $1,300,920,494.
The price of Solana has been on a tear in recent weeks, as the altcoin market has begun to heat up once again. Following a period of consolidation around $30, SOL prices have begun to rise and are now trading above $35.
Solana Price Movement in the Last 24 Hours
The Solana price chart on a daily basis shows that the coin has met resistance at the $36.87 mark and may rise higher to $40 if it breaks above this barrier. If the price does not break above this resistance level, however, we may see a retrace toward the $32.76 support level. The daily 50-MA and 200-MA are presently at $34.09 and $33.15, indicating that the most likely path of least resistance is to the upside.
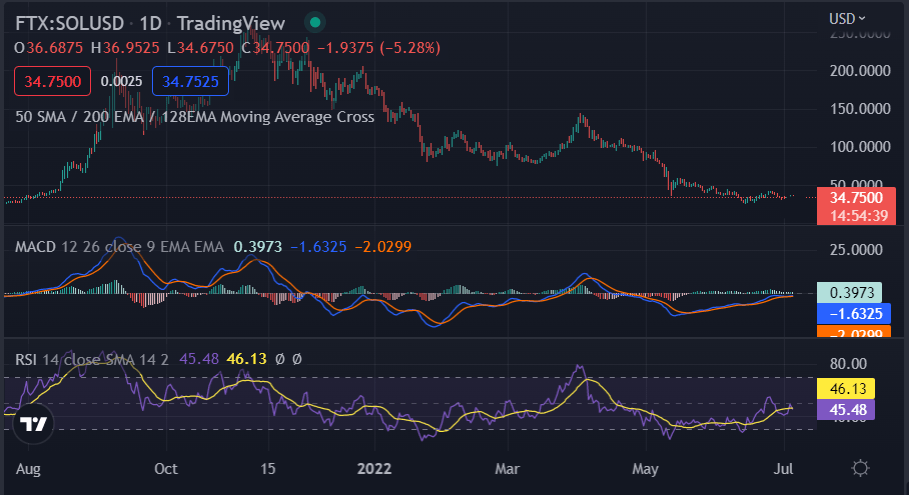
Source: TradingView
On the 24-hour chart, SOL/USD has formed a bullish flag pattern as the Moving average convergence divergence indicator is currently in the optimistic range. This shows that the coin is likely to continue its climb in the near future. The current RSI for the pair is approaching overbought levels, which might lead to profit-taking in the short term.
Solana Technical Analysis on the 4-Hour Price Chart
The Solana price chart for the last 4 hours shows that the coin has retreated back to its highs as the bulls take a rest. The pair's RSI is presently in overbought territory, suggesting that prices could undergo a correction in the near future. The MACD signal, on the other hand, is still in the bullish zone, suggesting that the bulls are still in control of the market. The 50-MA is rising above the 200-MA, which is indicative of a bull trend.
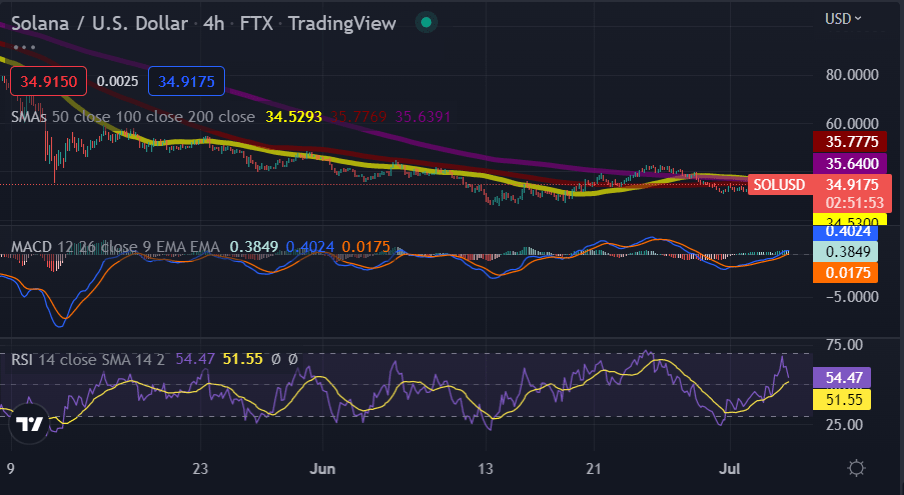
Source: TradingView
Conclusion
A bullish trend momentum is indicated in SOL technical analysis. The coin has encountered some resistance at the $36.87 mark, but it appears ready to continue its upward trajectory in the near future. As a break below this level might indicate, keep an eye on the $32.76 support zone as a potential fall to around the $30 level