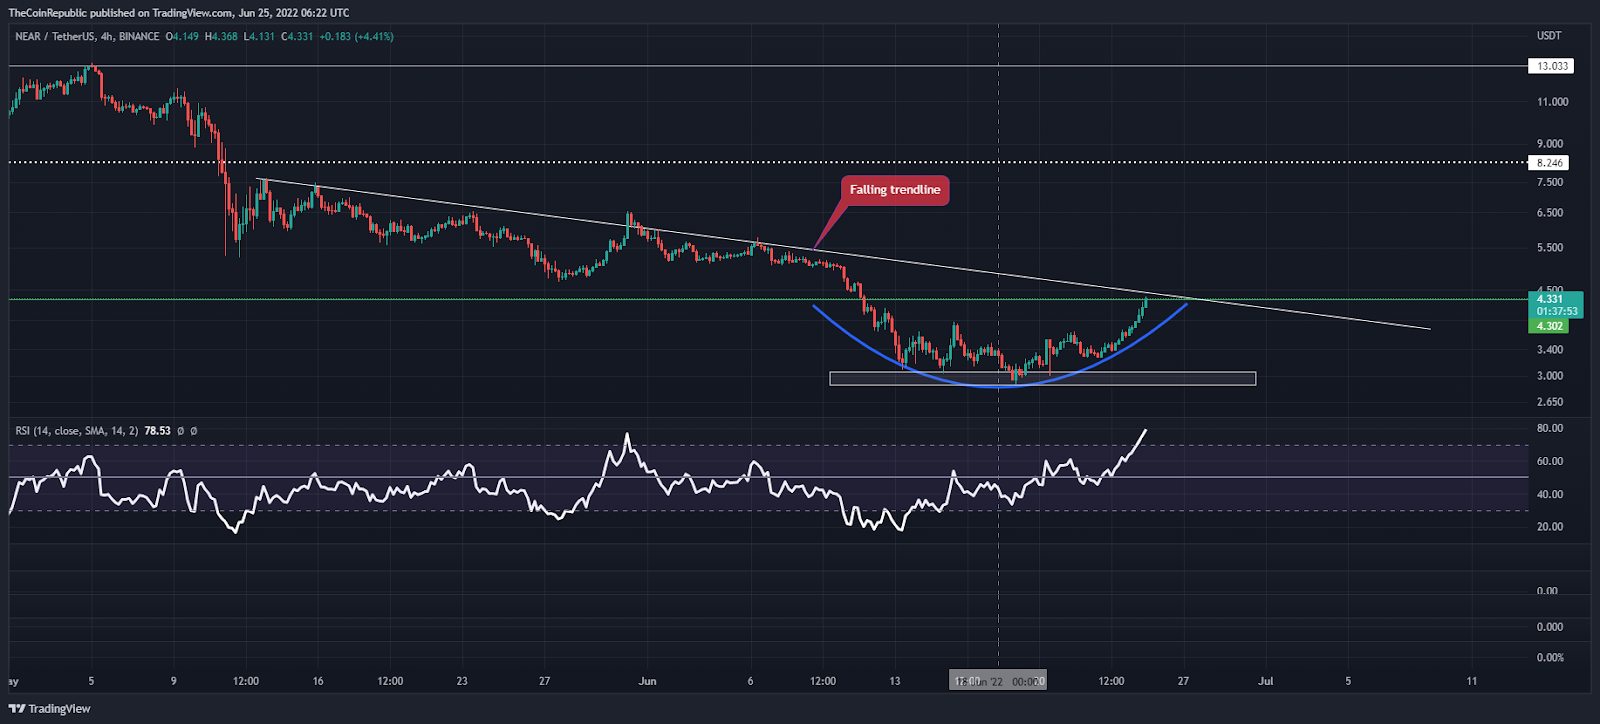
- Near Protocol price action is forming a rounding bottom formation near the 90-day low of $2.9 mark.
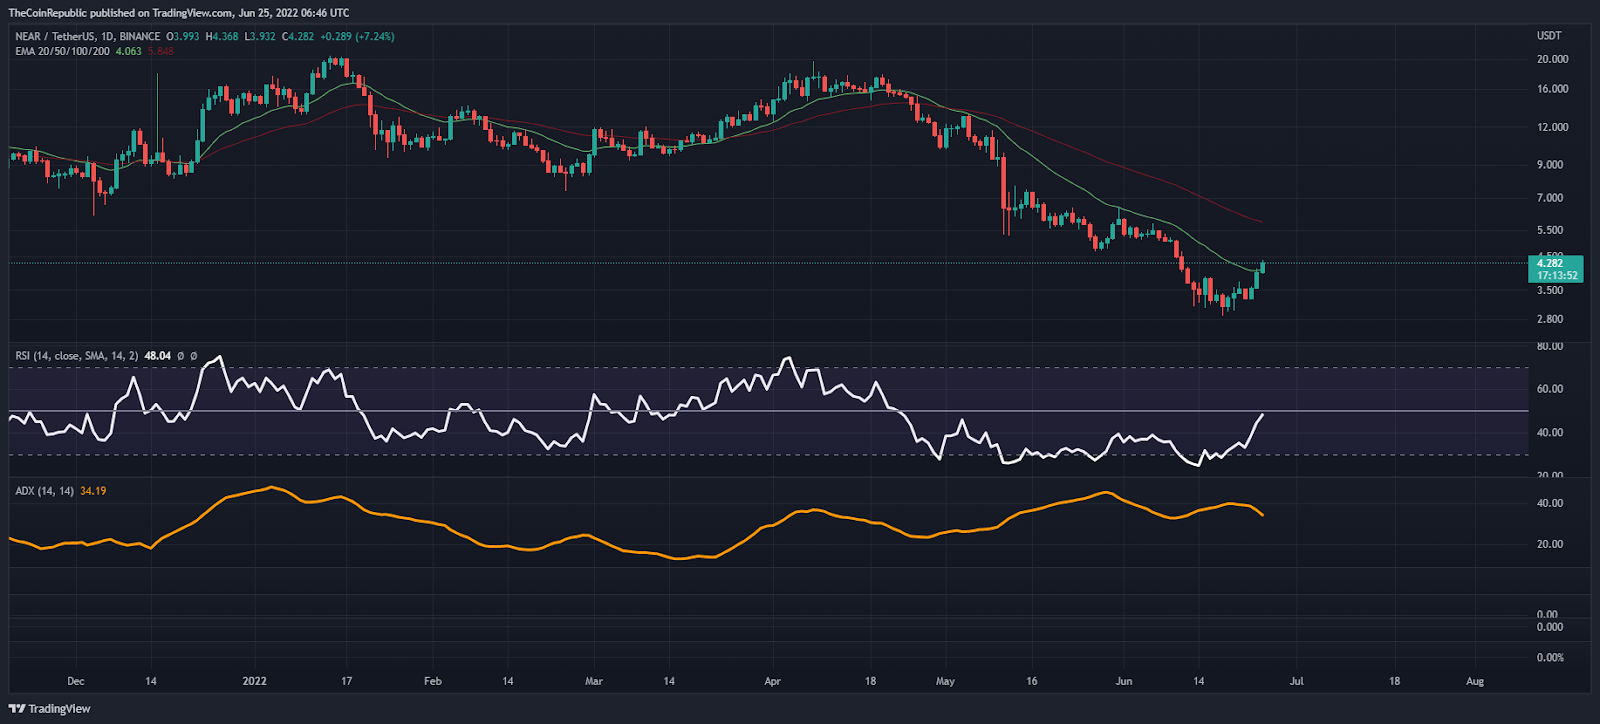
- Today the bulls are attempting to close the daily price candle above the 20-day exponential moving average.
- NEAR price with bitcoin pair is trading at 0.0002033 Satoshis, up 14.3% in the green zone.
Near Protocol price is bouncing back near its 2022 low of $2.9. Near Coin forms a Selling Bullish candle this week after two bearish weekends. Meanwhile, NEAR investors gained about 30% of the cost this week.
At the time of writing, NEAR Protocol is trading at the $4.31 mark. During the bounce-back, the altcoin was priced at $4.3 Mark. but refers to the highest pearl of 12 days

Meanwhile, the NEAR speculator became part of a round bottom formation near the 90-day low of the $2.9 mark on the 4-hours price chart. The recent low of $2.9 has become an important support level for the bulls.
After 3 days of continuous bullish momentum, the market cap of the NEAR protocol reached above $3.1 billion last night with a gain of 18% over the past 24 hours, according to CMC data.
During a bullish trend, the NEAR coin is about to hit a downsloping trendline (white) in the context of the daily price chart. Above this resistance area, the bulls are likely to record a selloff move towards the $6.0 mark at the current level.
Is the 20 EMA support for bulls?

In an intraday trading session, bulls attempt to close the daily price candle above the 20-day exponential moving average. Above stability above the 20 EMA, the bulls may see a pullback at the 50 EMA.
Meanwhile, the daily RSI is near the semi-line but the ADX indicator is showing a slightly weaker bullish trend in the Near protocol.
Conclusion
Although the Near Protocol coin is in recovery mode, bulls may attempt to sell on the down-sloping trendline (White). But above the stability above the 20 EMA, the bulls may pull back at the 50 EMA.
Support level- $3.0 and $2.8
Resistance level- 4.5 and $7.3
Disclaimer
The views and opinions stated by the author, or any people named in this article, are for informational ideas only, and they do not establish the financial, investment, or other advice. Investing in or trading crypto assets comes with a risk of financial loss.
ALSO READ: Zcash Price Analysis: Will ZEC successfully Escape Falling Wedge Pattern?
 thecoinrepublic.com