Chainlink price analysis shows that the cryptocurrency has seen a strong bullish run in the past few hours. The LINK/USD pair is currently trading at $6.95 and is heading towards the $7.02 resistance while support is present at $6.50.The cryptocurrency has seen a strong rally in the past few days and has broken out of the descending triangle pattern that it was trading in. The breakout from the descending triangle has opened up upside potential for the LINK/USD pair.
The next major resistance for the pair is present at the $7.02 level. However, if the cryptocurrency fails to break out of this level, it could retrace back to the $6.50 support level. Chainlink has increased by more than 5% in the past 24 hours and is currently one of the best-performing cryptocurrencies. The cryptocurrency has a market capitalization of $3,239,843,014 and is ranked number 9 on CoinMarketCap, while the volume market capitalization is currently $524,804,892.
Chainlink price movement in the last 24 hours: Bulls mount pressure
The 1-day Chainlink price analysis chart has seen a strong rally over the past few days as it surged from $4.50 to its current price of $6.95.The sellers controlled the market in the past week as a bearish wave was expanding. But today, an unexpected increase was experienced by the cryptocurrency as its value moved up to $6.95 high before a minor retracement took place. The last 24-hour candlestick has closed as a bullish engulfing candlestick, which is a sign of further upside potential.
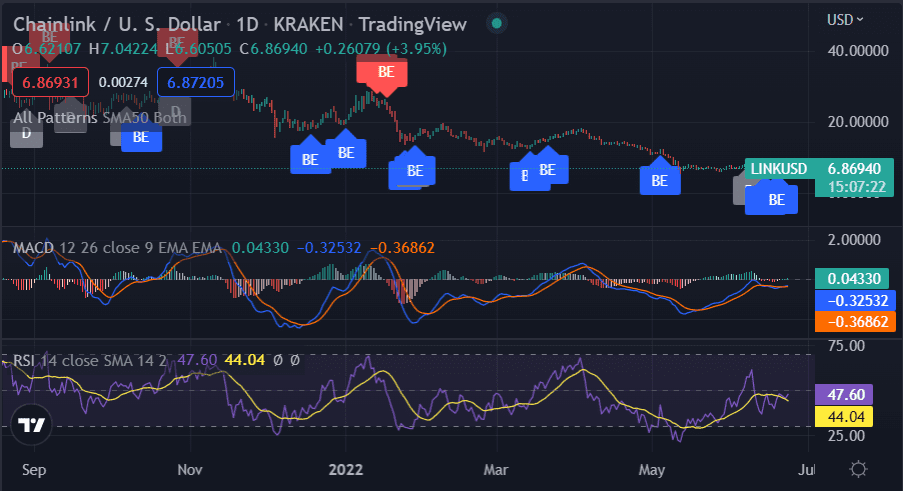
The Relative Strength Index is currently in the overbought territory, which suggests that the rally could be overextended in the near term. However, the MACD indicator is still in the bullish territory, which suggests that bulls are in control of the market.
Chainlink price analysis on a 4-hour price chart: LINK tests resistance at $7.02
The 4-hour Chainlink price analysis shows that the cryptocurrency has seen a strong bullish run over the past few hours. The LINK/USD pair is currently trading above the $6.95 level and is heading towards the $7.02 resistance level. However, if the cryptocurrency fails to break out of this level, it could retrace back to the $6.50 support level.
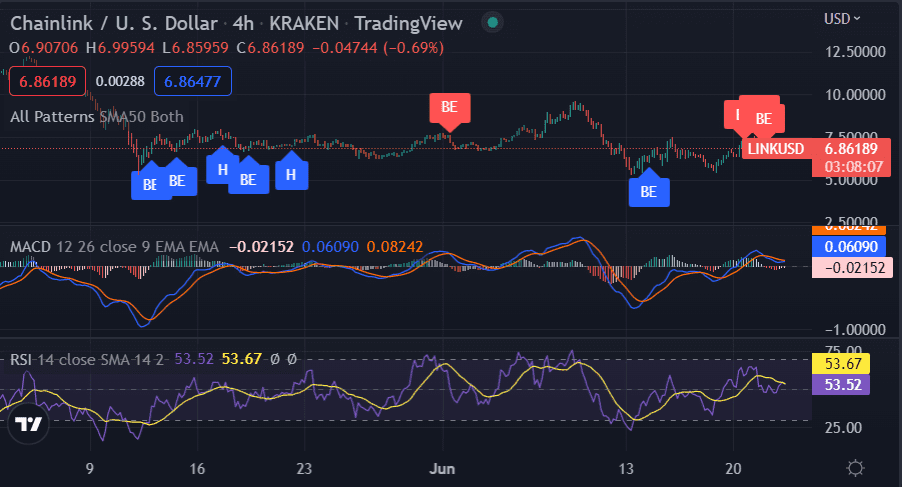
The 4-hour MACD indicator is currently above the zero line, which suggests that bulls are in control of the market. The RSI indicator is currently near the overbought territory, which suggests that the rally could be overextended in the near term. The Candlestick pattern suggests that the cryptocurrency could see a bullish reversal in the near term.
Chainlink price analysis conclusion
To conclude, Chainlink price analysis shows that the price is currently in a bullish trend as the market is seeing a price increase. The current market trend for Chainlink is bullish as the price has been appreciating in the last 24 hours. The technical indicators are all pointing towards a further increase in prices in the near future. However, if the prices start to fall, the nearest support levels are present at $6.50 and Chainlink (LINK) has seen a slight price increase in the past 24 hours as the digital asset trades around the $6.95 price level.
Disclaimer. The information provided is not trading advice. Cryptopolitan.com holds no liability for any investments made based on the information provided on this page. We strongly recommend independent research and/or consultation with a qualified professional before making any investment decisions.