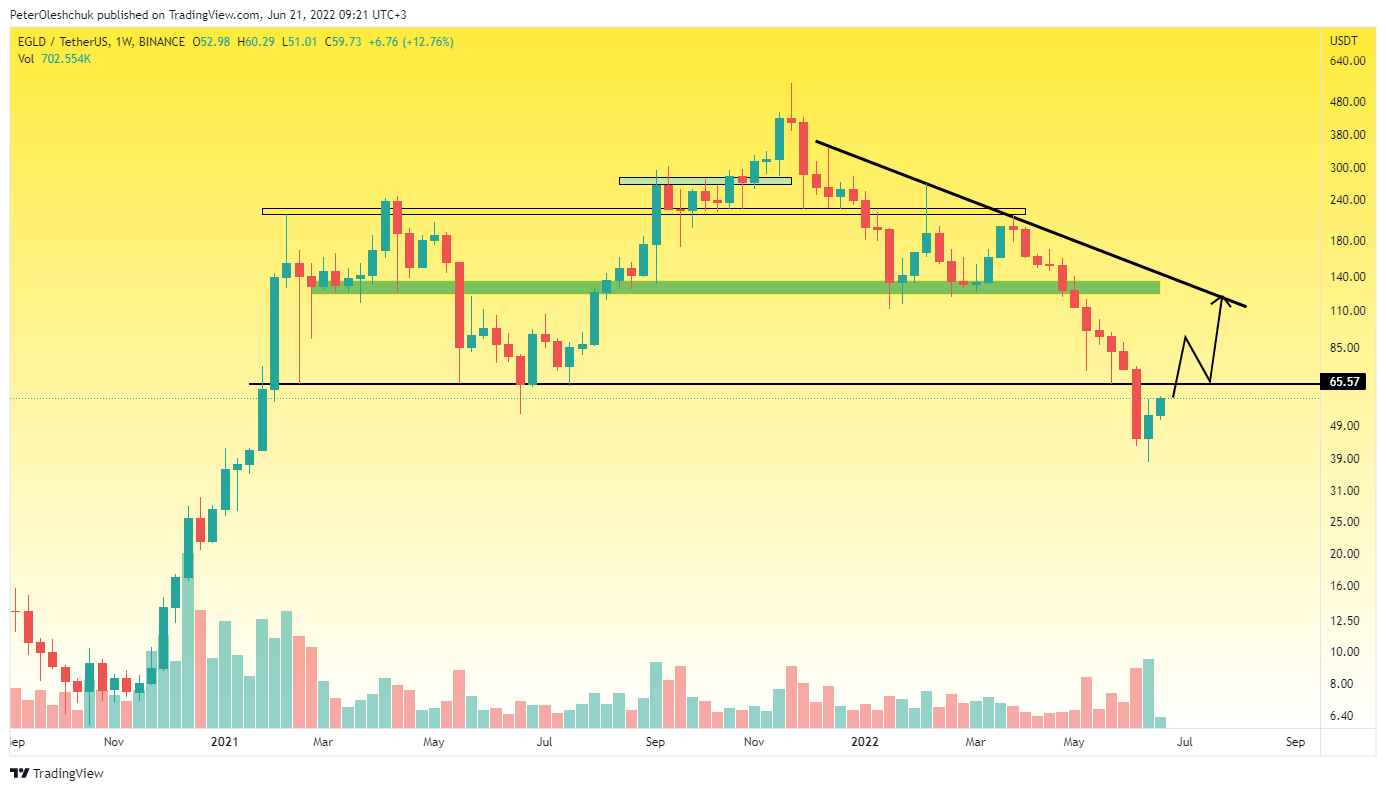
Eleven weeks of continuous fall is a record for the EGLD cryptocurrency. Until April 2022, there were no such trading situations on the EGLD chart. With this fall, sellers reached the update of local lows from May 2021. The highest trading volumes during the last fall wave were recorded on the weekly candles of 9 May and 13 June. In the first case, the increased volumes were due to the test of the range of local lows in May 2021. In the second case, the increased volumes were formed by triggering stop orders of buyers who stopped believing in the future growth of EGLD.  Source: https://www.tradingview.com/x/8QzA1axy/ At the time of writing, the $65.29 mark is under the control of sellers. This is the main liquidity level, which buyers can take again to plan the growth of EGLD. However, if during the week of 20 June, buyers are unable to break and fix above the $65.29 mark, the EGLD fall will continue. In this case, the next immediate target is $34. Though, given the uncorrected fall wave of April 2022, we expect buyers to return the mark of $65.29 and continue the correction up to $125. It is from this mark that a new fall wave is likely to begin.
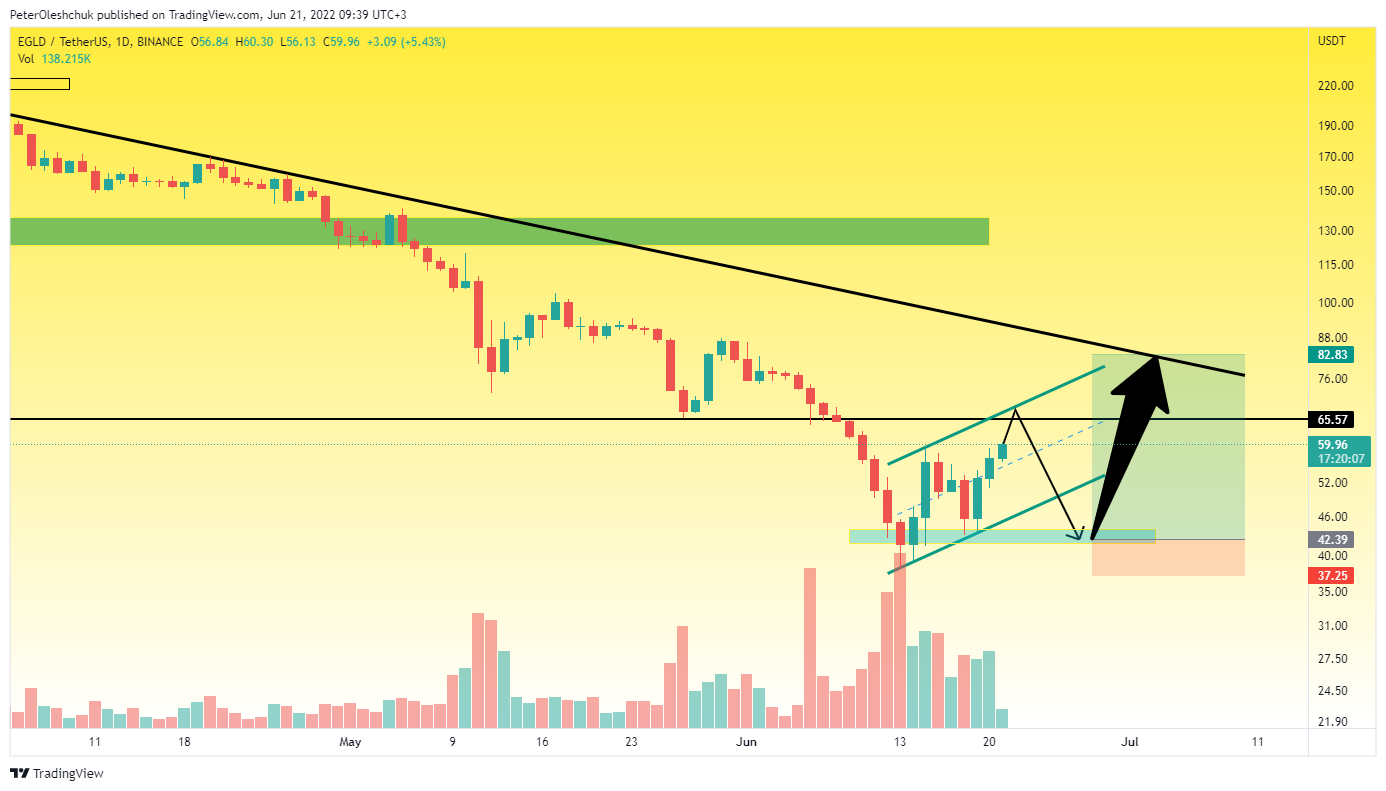
EGLD Technical Analysis on The Daily Timeframe
 Source: https://www.tradingview.com/x/lVtYJiIs/ Analyzing the movement of EGLD price on the daily timeframe, we can see that the price rebound is formed in a sloping growth channel. Although the trading volumes during the local growth of EGLD price increased - it does not give a significant result to buyers. This fact suggests that a large number of sellers remain in the market, which even at local lows tends to enter the short position. In order for buyers to be able to continue to grow without obstacles with the first target of $82, they should be tested again for strength in the range of $42. It was there that on 12 June, the EGLD price began to stop its wild rate of decline. And on 18 June, new local growth began just after the $42 test. Therefore, in the range of this mark will be a great chance to buy EGLD with acceptable risks.
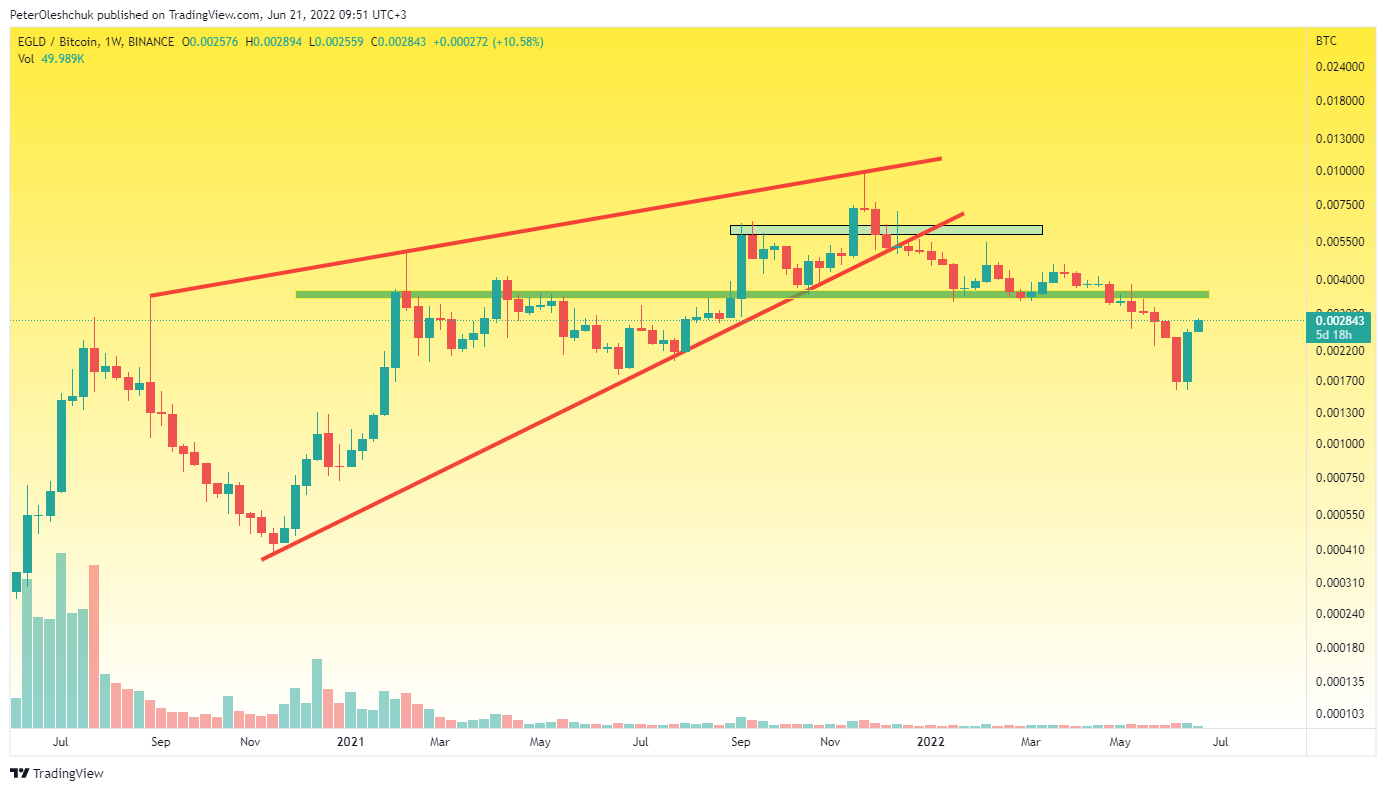
EGLDBTC Price Has A Growth Prospect Of 30%
 Source: https://www.tradingview.com/x/iMr9952m/ If on the weekly chart of the EGLDUSDT pair the price is below the local lows of May-June 2021, then on the EGLDBTC chart the price organized a false break of the local lows. Buyers closed the weekly candle from 13 June quite aggressively. About 30% of the price increase remained for the nearest zone of resistance. The main problem for buyers is around 0.0036. It was due to the loss of control of buyers over this mark in April and formed a new EGLDBTC fall wave. While the 0.0036 mark is under the control of sellers, we do not recommend investing in EGLD cryptocurrency.
 cryptoknowmics.com