Avalanche price analysis is currently in a bearish trend as the AVAX/USD pair has depreciated to the $16.00 mark. The market had attempted to rally yesterday but was unable to sustain the bullish momentum and pulled back below the $16.75 resistance level. The resistance at $16.75 is still in play as the market looks to retest this level. If the market can break above this resistance, we could see a move towards the $17.50 area. However, if the market fails to break above $16.75, we could see a move back down to the $15.56 support level.
Avalanche price has been continuously declining for the last few days as it breached the $17.00 support level and reached as low as $16.35 The market has been facing resistance at the $16.75 level and has been unable to break above this level while the market is currently trading at the $16.00 mark. Avalanche is down by 1.35% in the last 24 hours as its volume market is at $524 million while the market cap is at $2.07 billion.
AVAX/USD 1-day price analysis: Avalanche consolidates around the $16.00 mark
On 24-hour Avalanche price analysis shows that the market has been facing rejection at the $16.75 level after a brief period of consolidation. The prices have been stuck between the $15.56 to $16.75 range and it seems like the market will start heading upwards once it breaks out of this range. Investors should look for a breakout above the $16.75 resistance or a breakdown below the $15.56 support to enter into new positions.
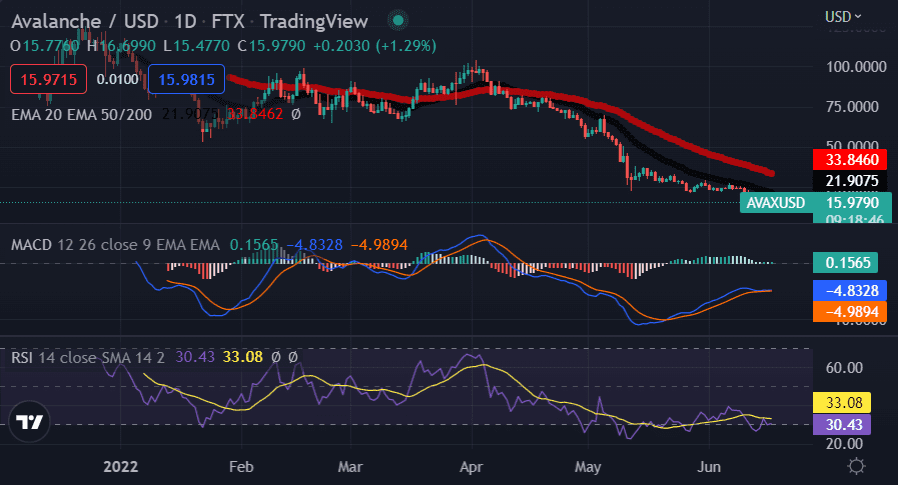
The technical indicators are currently giving mixed signals as the RSI is trading at the 50 level which indicates that the market is currently in a state of indecision. The MACD indicator is also currently in a neutral zone as the histogram is flatlining. However, the momentum is starting to turn positive which could indicate that the market is about to make a move. The EMA’s are currently giving a bearish signal as the 50 EMA is below the 200 EMA.
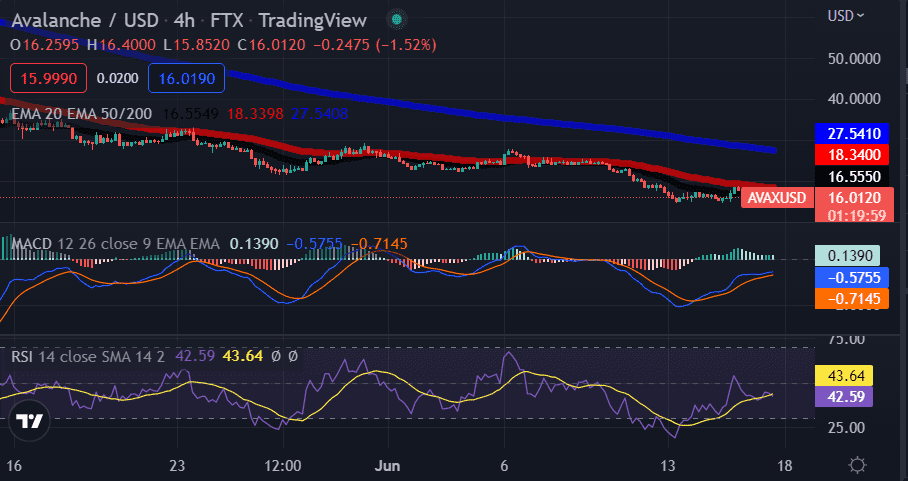
AVAX/USD 4-hour chart: Bulls emerge as the market starts to consolidate
On the 4-hour Avalanche price analysis chart, we can see that the market has started to consolidate around the $16.30 mark after a brief period of decline. Bulls emerge after the market found support at the $15.56 level and the market looks like it will start to head towards the $16.75 resistance level. The RSI is currently trading at the 53 level which indicates that the market still has room to move higher. The MACD indicator is currently in a bullish zone as the histogram is slowly moving upwards. The EMA’s are currently giving a bullish signal as the 50 EMA is above the 200 EMA.
Avalanche prie analysis conclusion
Avalanche price analysis shows a bearish trend in the 24-hour timeframe as the market is currently trading at $16.30 after facing rejection at $16.75. On the 4-hour chart, we see that the market has started to consolidate around the $16.30 mark as bulls emerge. The market looks like it will start to head towards the $16.75 resistance level in the near term.
Disclaimer. The information provided is not trading advice. Cryptopolitan.com holds no liability for any investments made based on the information provided on this page. We strongly recommend independent research and/or consultation with a qualified professional before making any investment decisions.