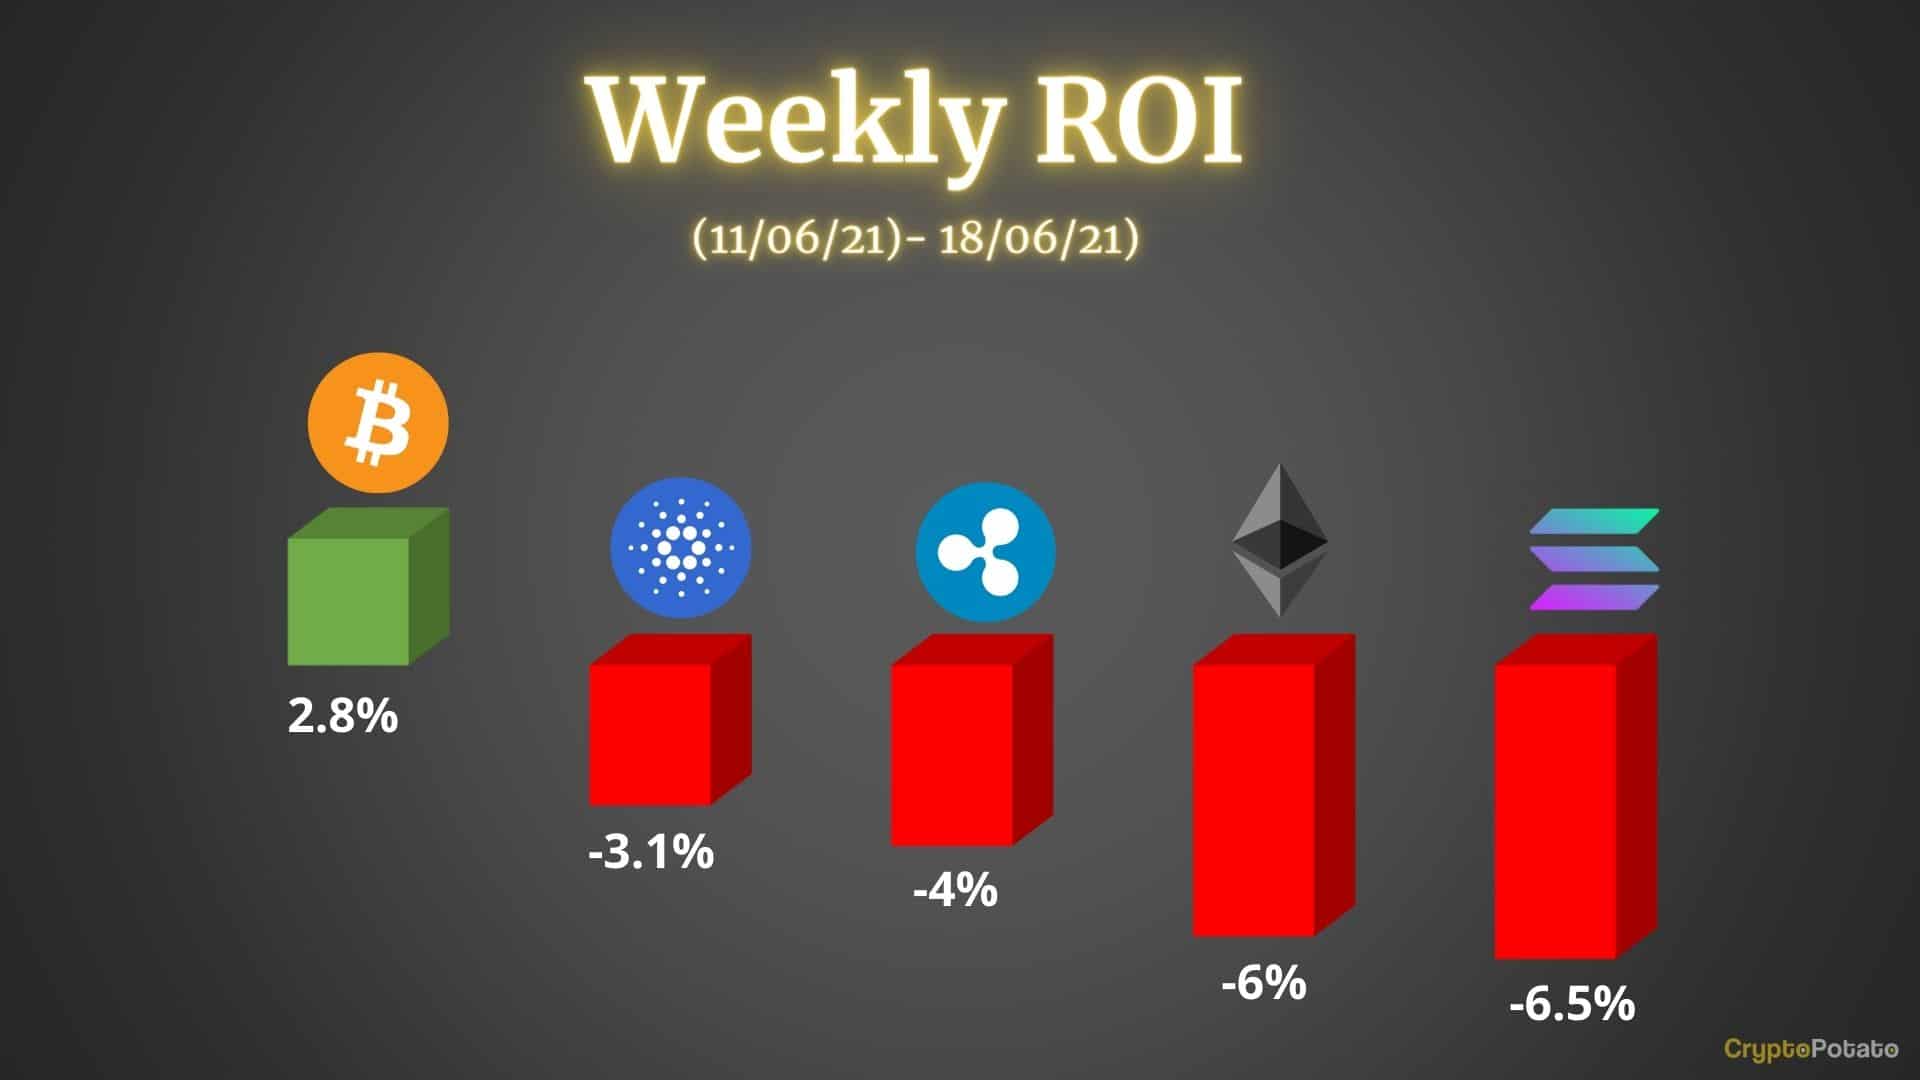
The last week was rather challenging for altcoins as most of the major ones are trading in the red. Bitcoin managed to pull ahead a bit, which also resulted in an increase in its market dominance.
Bitcoin
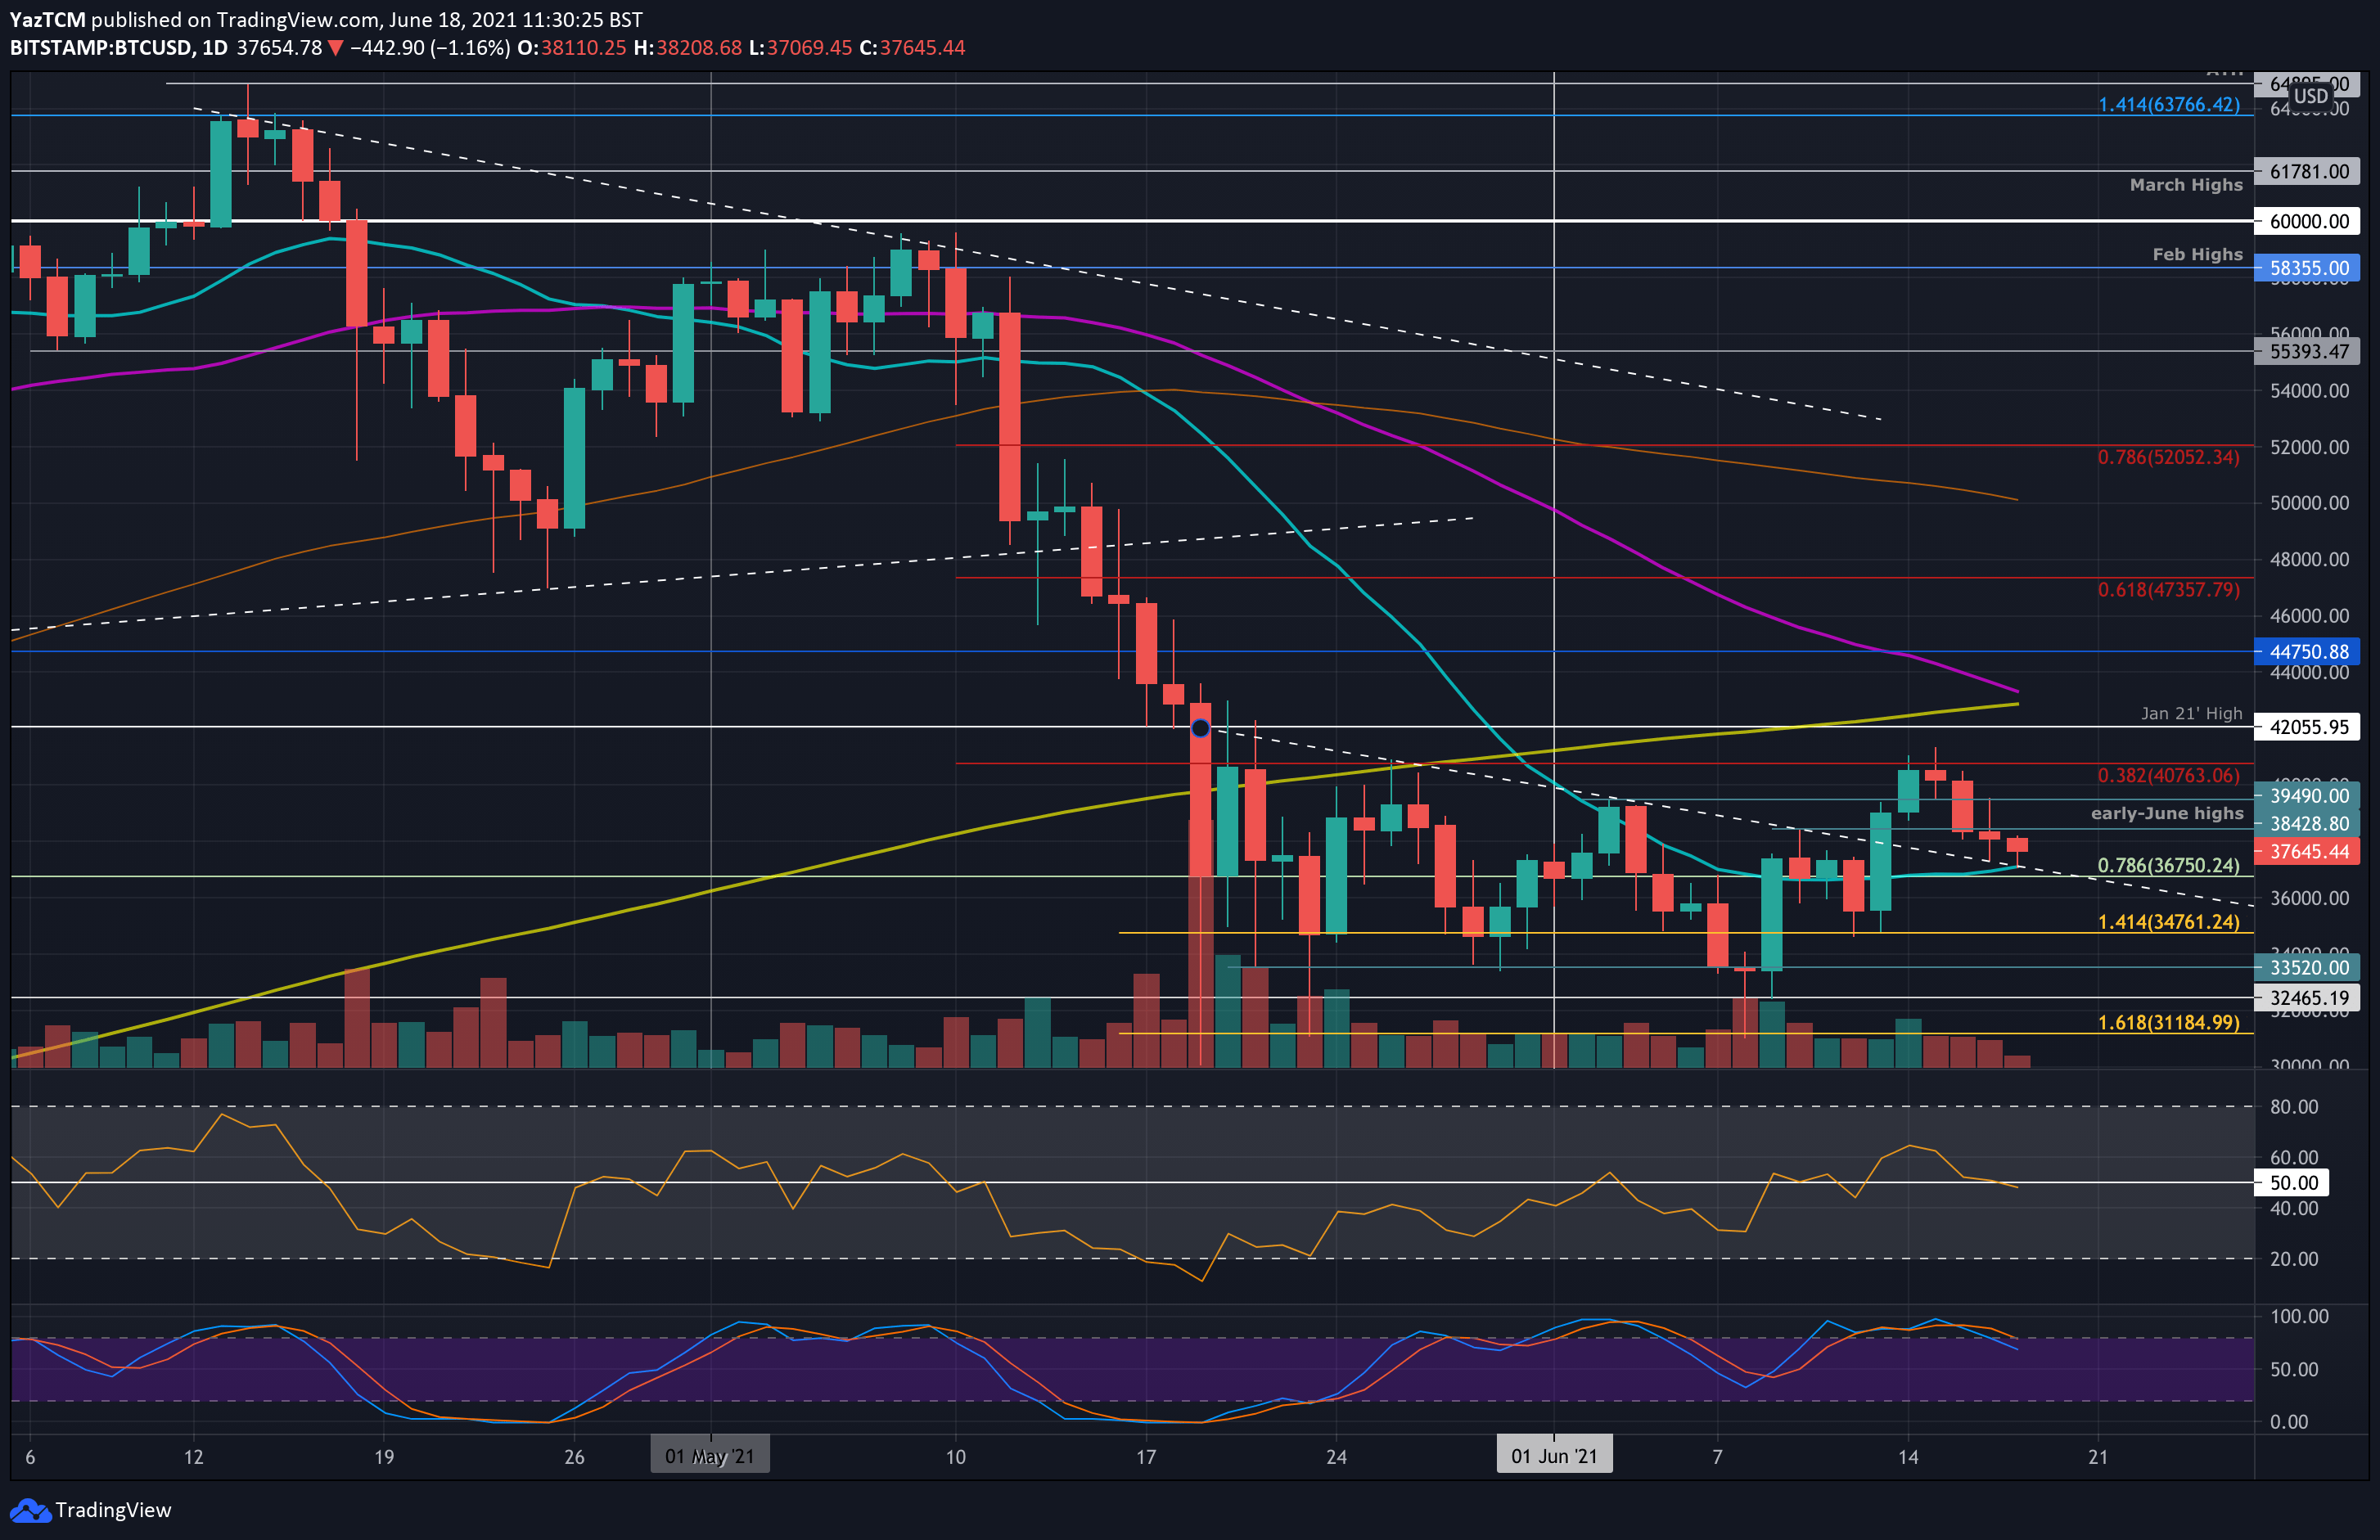
Bitcoin is up by a very small 2.8% over the past week as it currently trades at $37,900 – just above the 20-day MA.
The coin had provided some hope at the start of the week as it surged above $37,000 to break a falling trend line that has been in play since the mid-May market crash. After surpassing this trend line, it surged higher above $40,000 but failed to overcome resistance at $40,765 (bearish .382 Fib) and rolled over.
Since rolling over, BTC has dropped back beneath $40,000 over the past four days and recently founds support at the 20-day MA today at around $37,000.
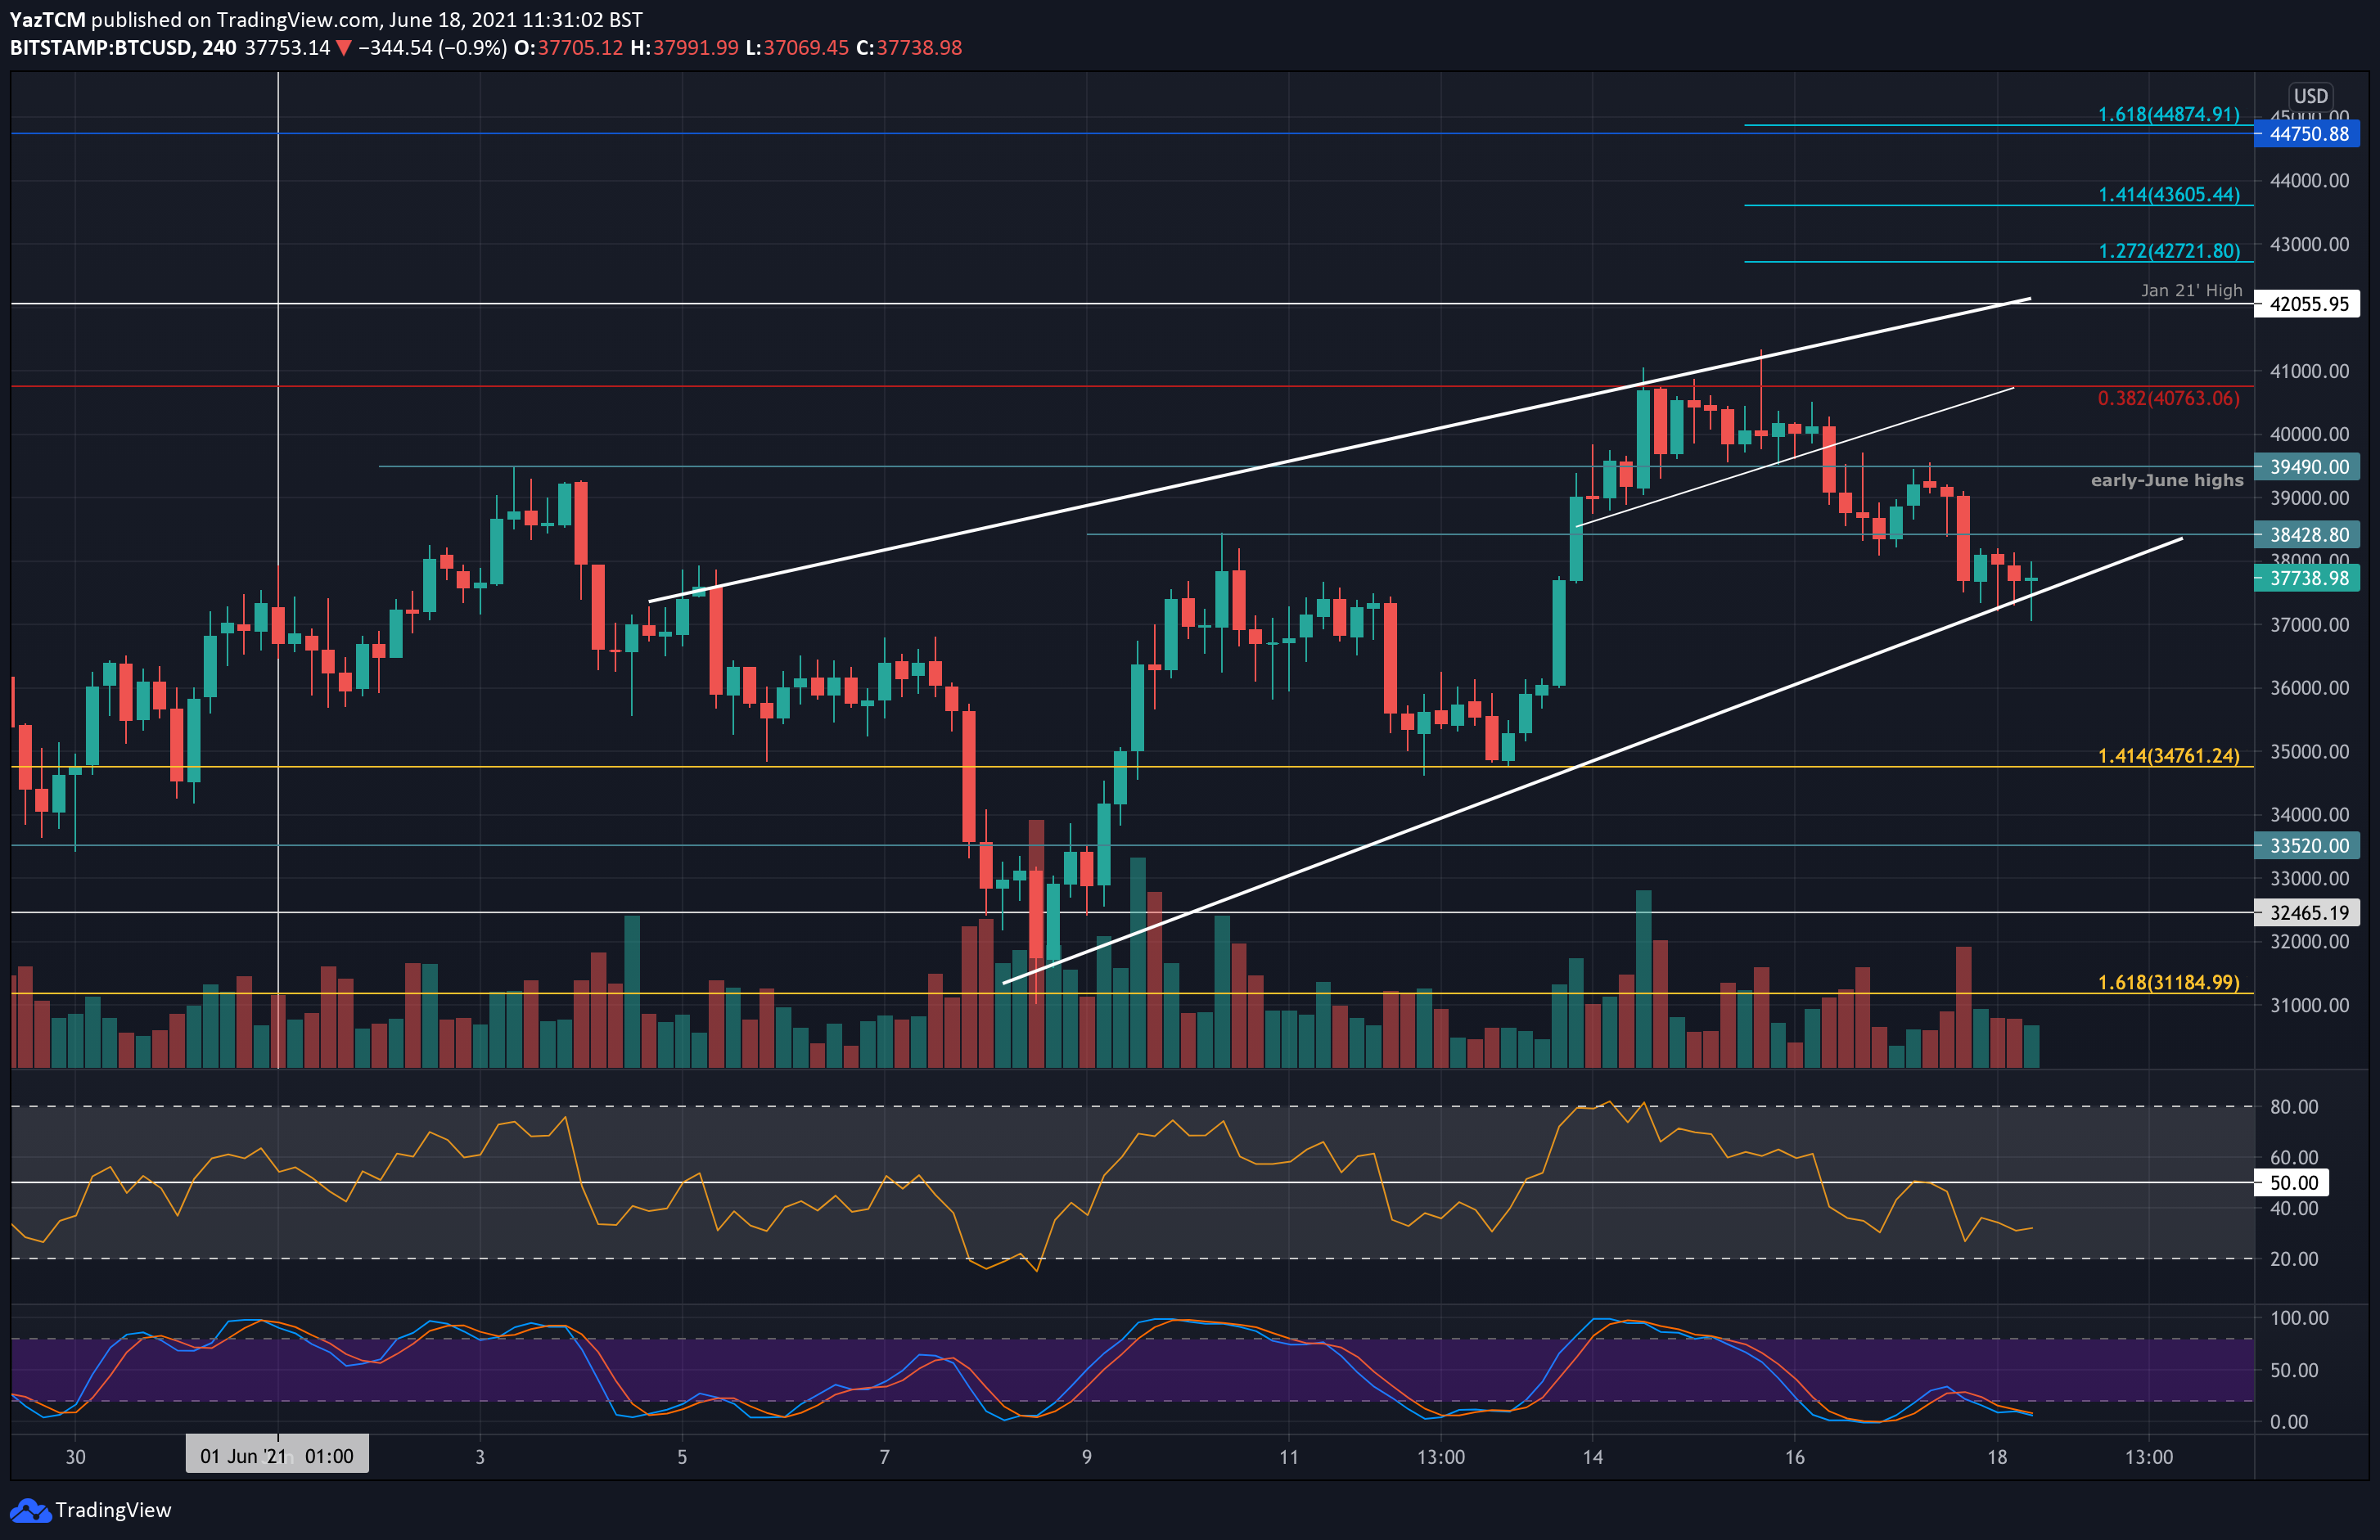
On the short-term 4HR chart, BTC is currently trading inside a rising wedge formation but is battling to remain above the lower boundary of the wedge.
Looking ahead, if the buyers can rebound from the bottom of the wedge, the first resistance lies at $38,430. This is followed by $39,00, $39,490 (early-June highs), $40,000, and $40,763 (bearish .382 Fib). Added resistance lies at $42,000 (upper boundary of the wedge) and $43,000 (200-day & 50-day MA).
On the other side, the first support lies at $37,000 (20-day MA & lower boundary of the wedge). Beneath this, support lies at $36,750 (.786 Fib), $36,000, $34,760 (downside 1.414 Fib Extension), $34,000, $33,520, and $32,,465.
Ethereum
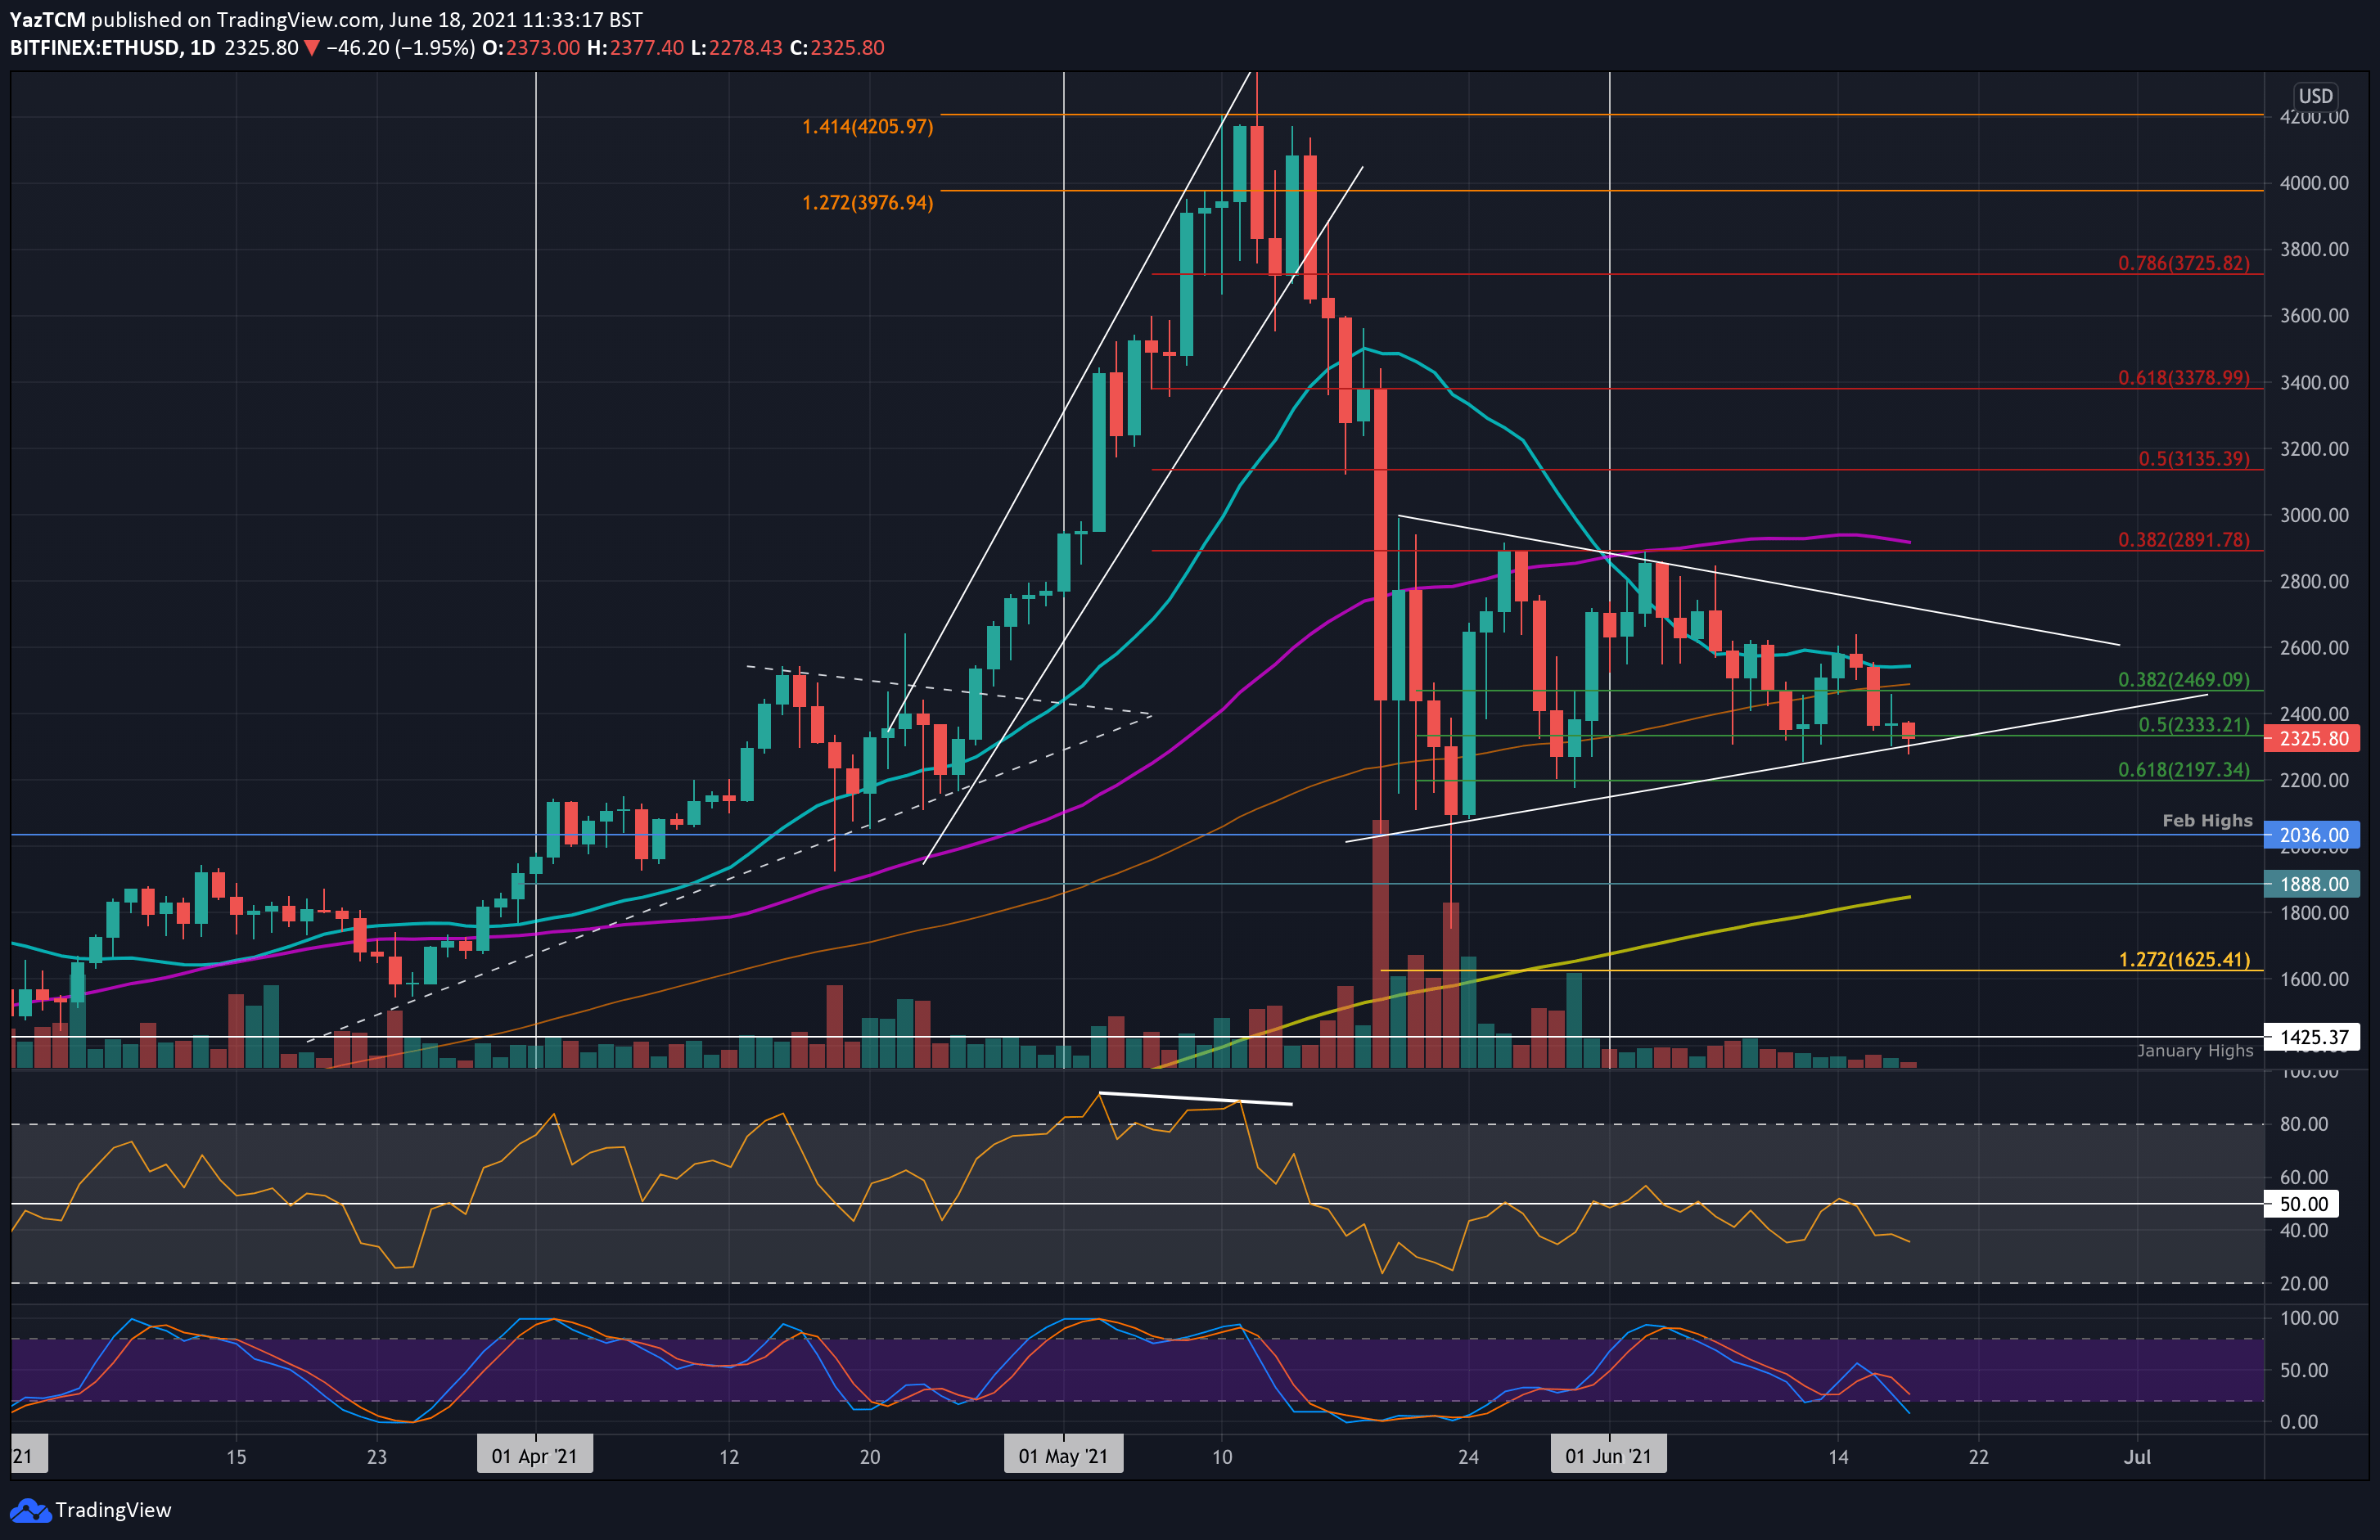
Ethereum is down by a steep 6% this week as it currently trades at around $2330. The coin is inside a symmetrical triangle pattern but the bears are pressing the lower boundary of the formation today.
ETH bounced from support at $2333 (.5 Fib) at the start of the week and managed to push higher into resistance at $2600. There, it failed to overcome the 20-day MA and has since dropped lower into the lower angle of the triangle.
Looking ahead, if the sellers push beneath the triangle, the first support lies at $2200 (.618 Fib). This is followed by $2036 (Feb 2021 highs), $2,000, and $1880 (200-day MA).
On the other side, the first resistance lies at $2470 (100-day MA). This is followed by $2500 (20-day MA), $2600, and $2700 (upper angle of the triangle).
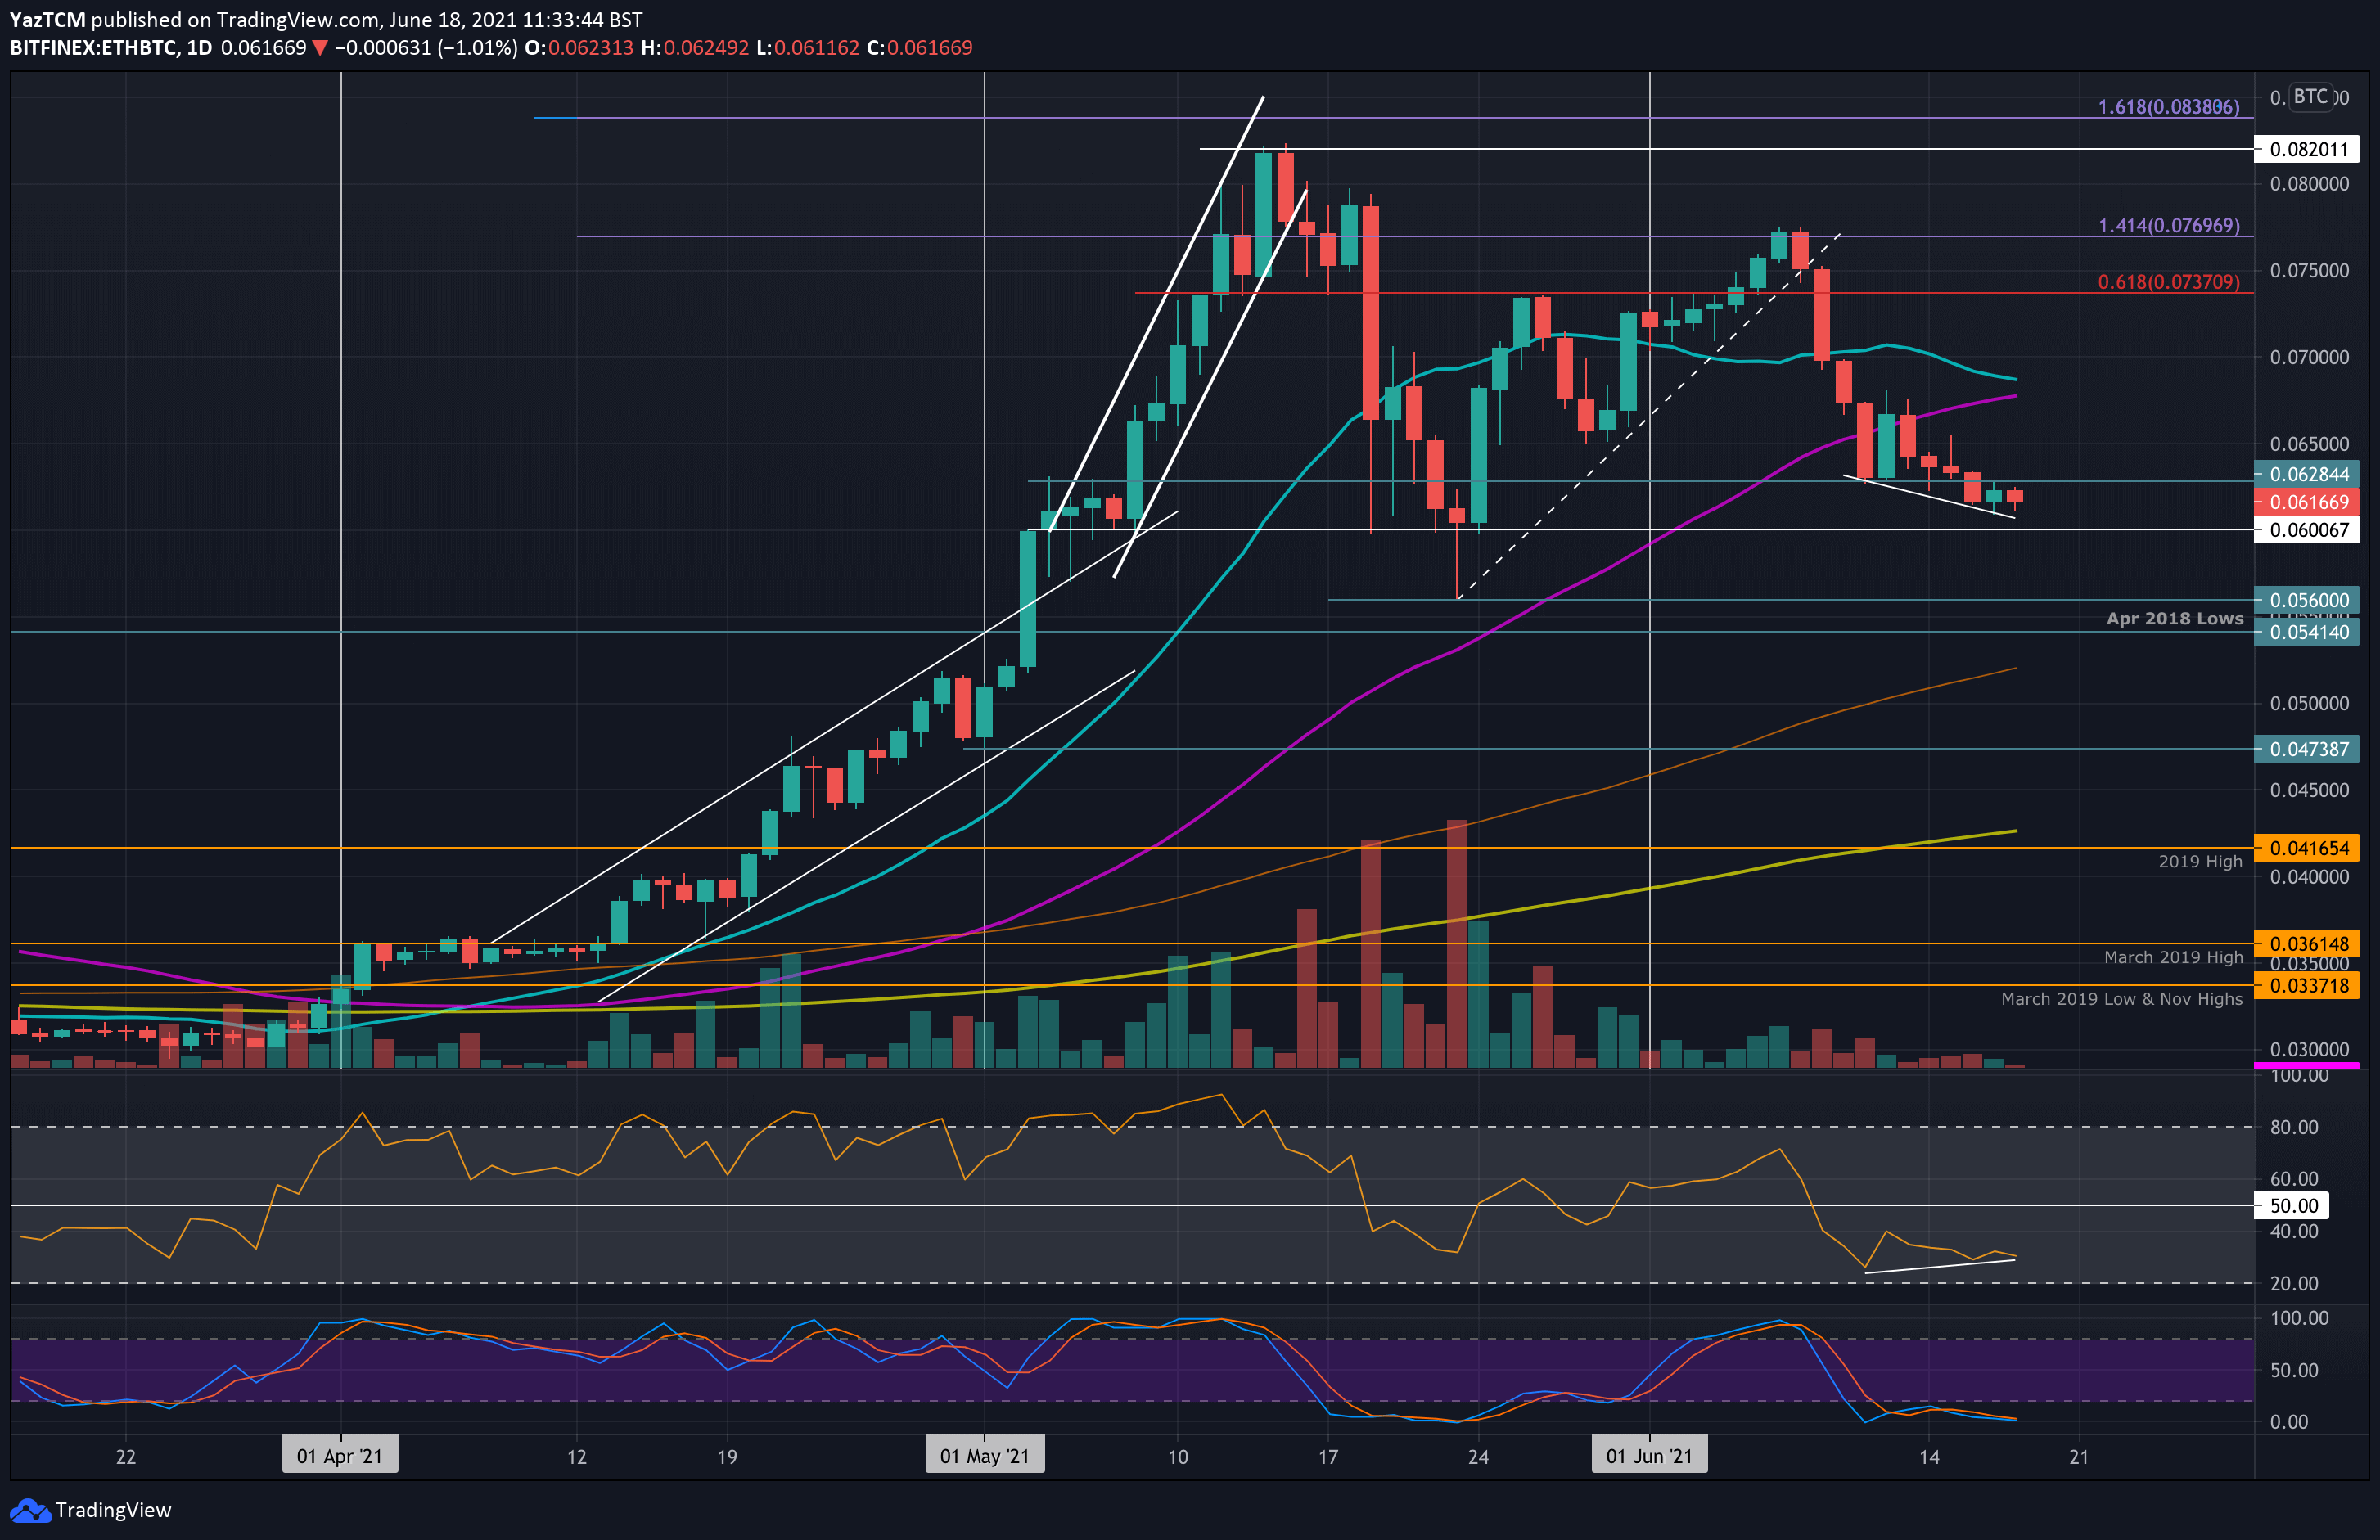
ETH continues to struggle against BTC since rolling over from resistance at 0.077 BTC at the start of June. The cryptocurrency had established support at 0.0628 BTC over the past week but the sellers penetrated beneath there on Wednesday to the current 0.0616 BTC level.
Looking ahead, if the sellers push lower, the first support lies at 0.06 BTC. This is followed by 0.056 BTC, 0.0541 BTC (April 2018 lows), and 0.0522 BTC (100-day MA).
On the other side, the first resistance lies at 0.0628 BTC. This is followed by 0.065 BTC, 0.068 BTC (50-day MA), and 0.07 BTC.
Ripple
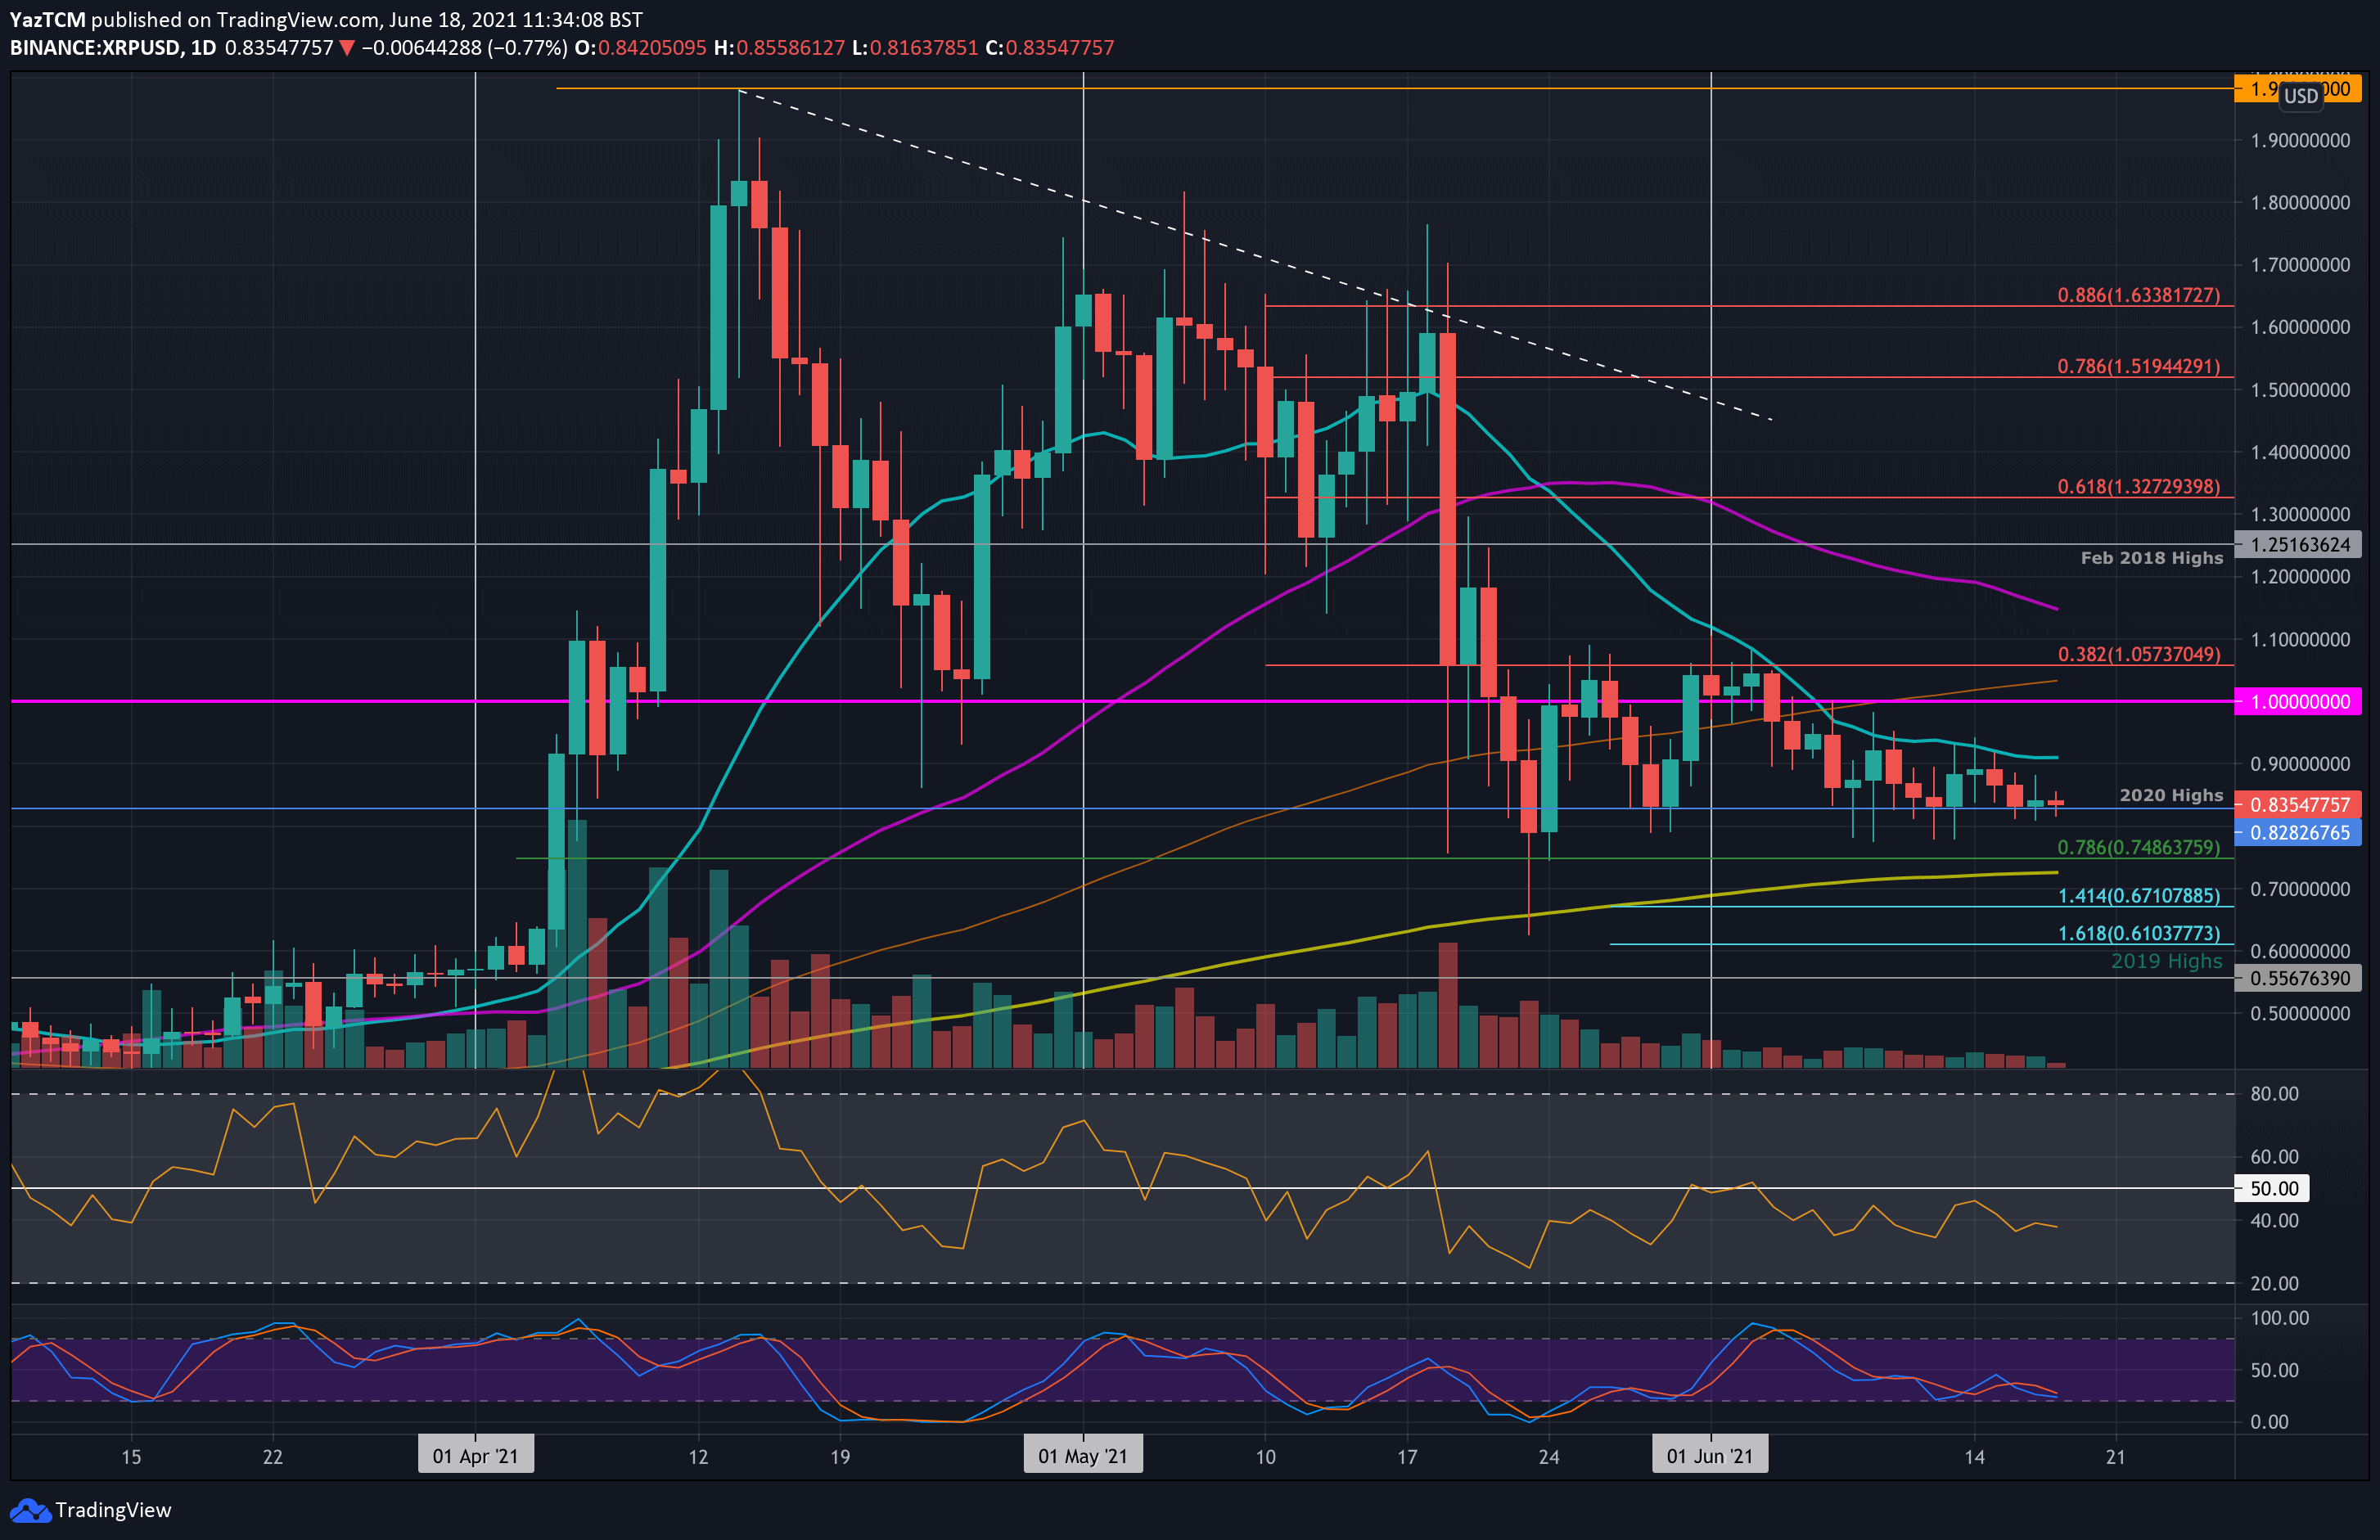
XRP is down 4.5% this week but is doing well to maintain the $0.8282 level. The cryptocurrency had established support here, provided by the 2020 highs, at the start of June, and has maintained it ever since.
XRP did attempt to push higher this week but was unable to overcome resistance at $0.9 (20-day MA). Since then, XRP dropped lower to $0.8282.
Looking ahead, if the sellers break the $0.8282 support, the first support lies at $0.75 (.786 Fib). This is followed by $0.72 (200-day MA), $0.7, $0.671 (downside 1.414 Fib Extension), and $0.613 (downside 1.618 Fib Extension).
On the other side, the first resistance lies at $0.9 (20-day MA). This is followed by $1.00, $1.05 (bearish .382 Fib & 100-day MA), $1.15 (50-day MA), and $1.25 (Feb 2018 highs).
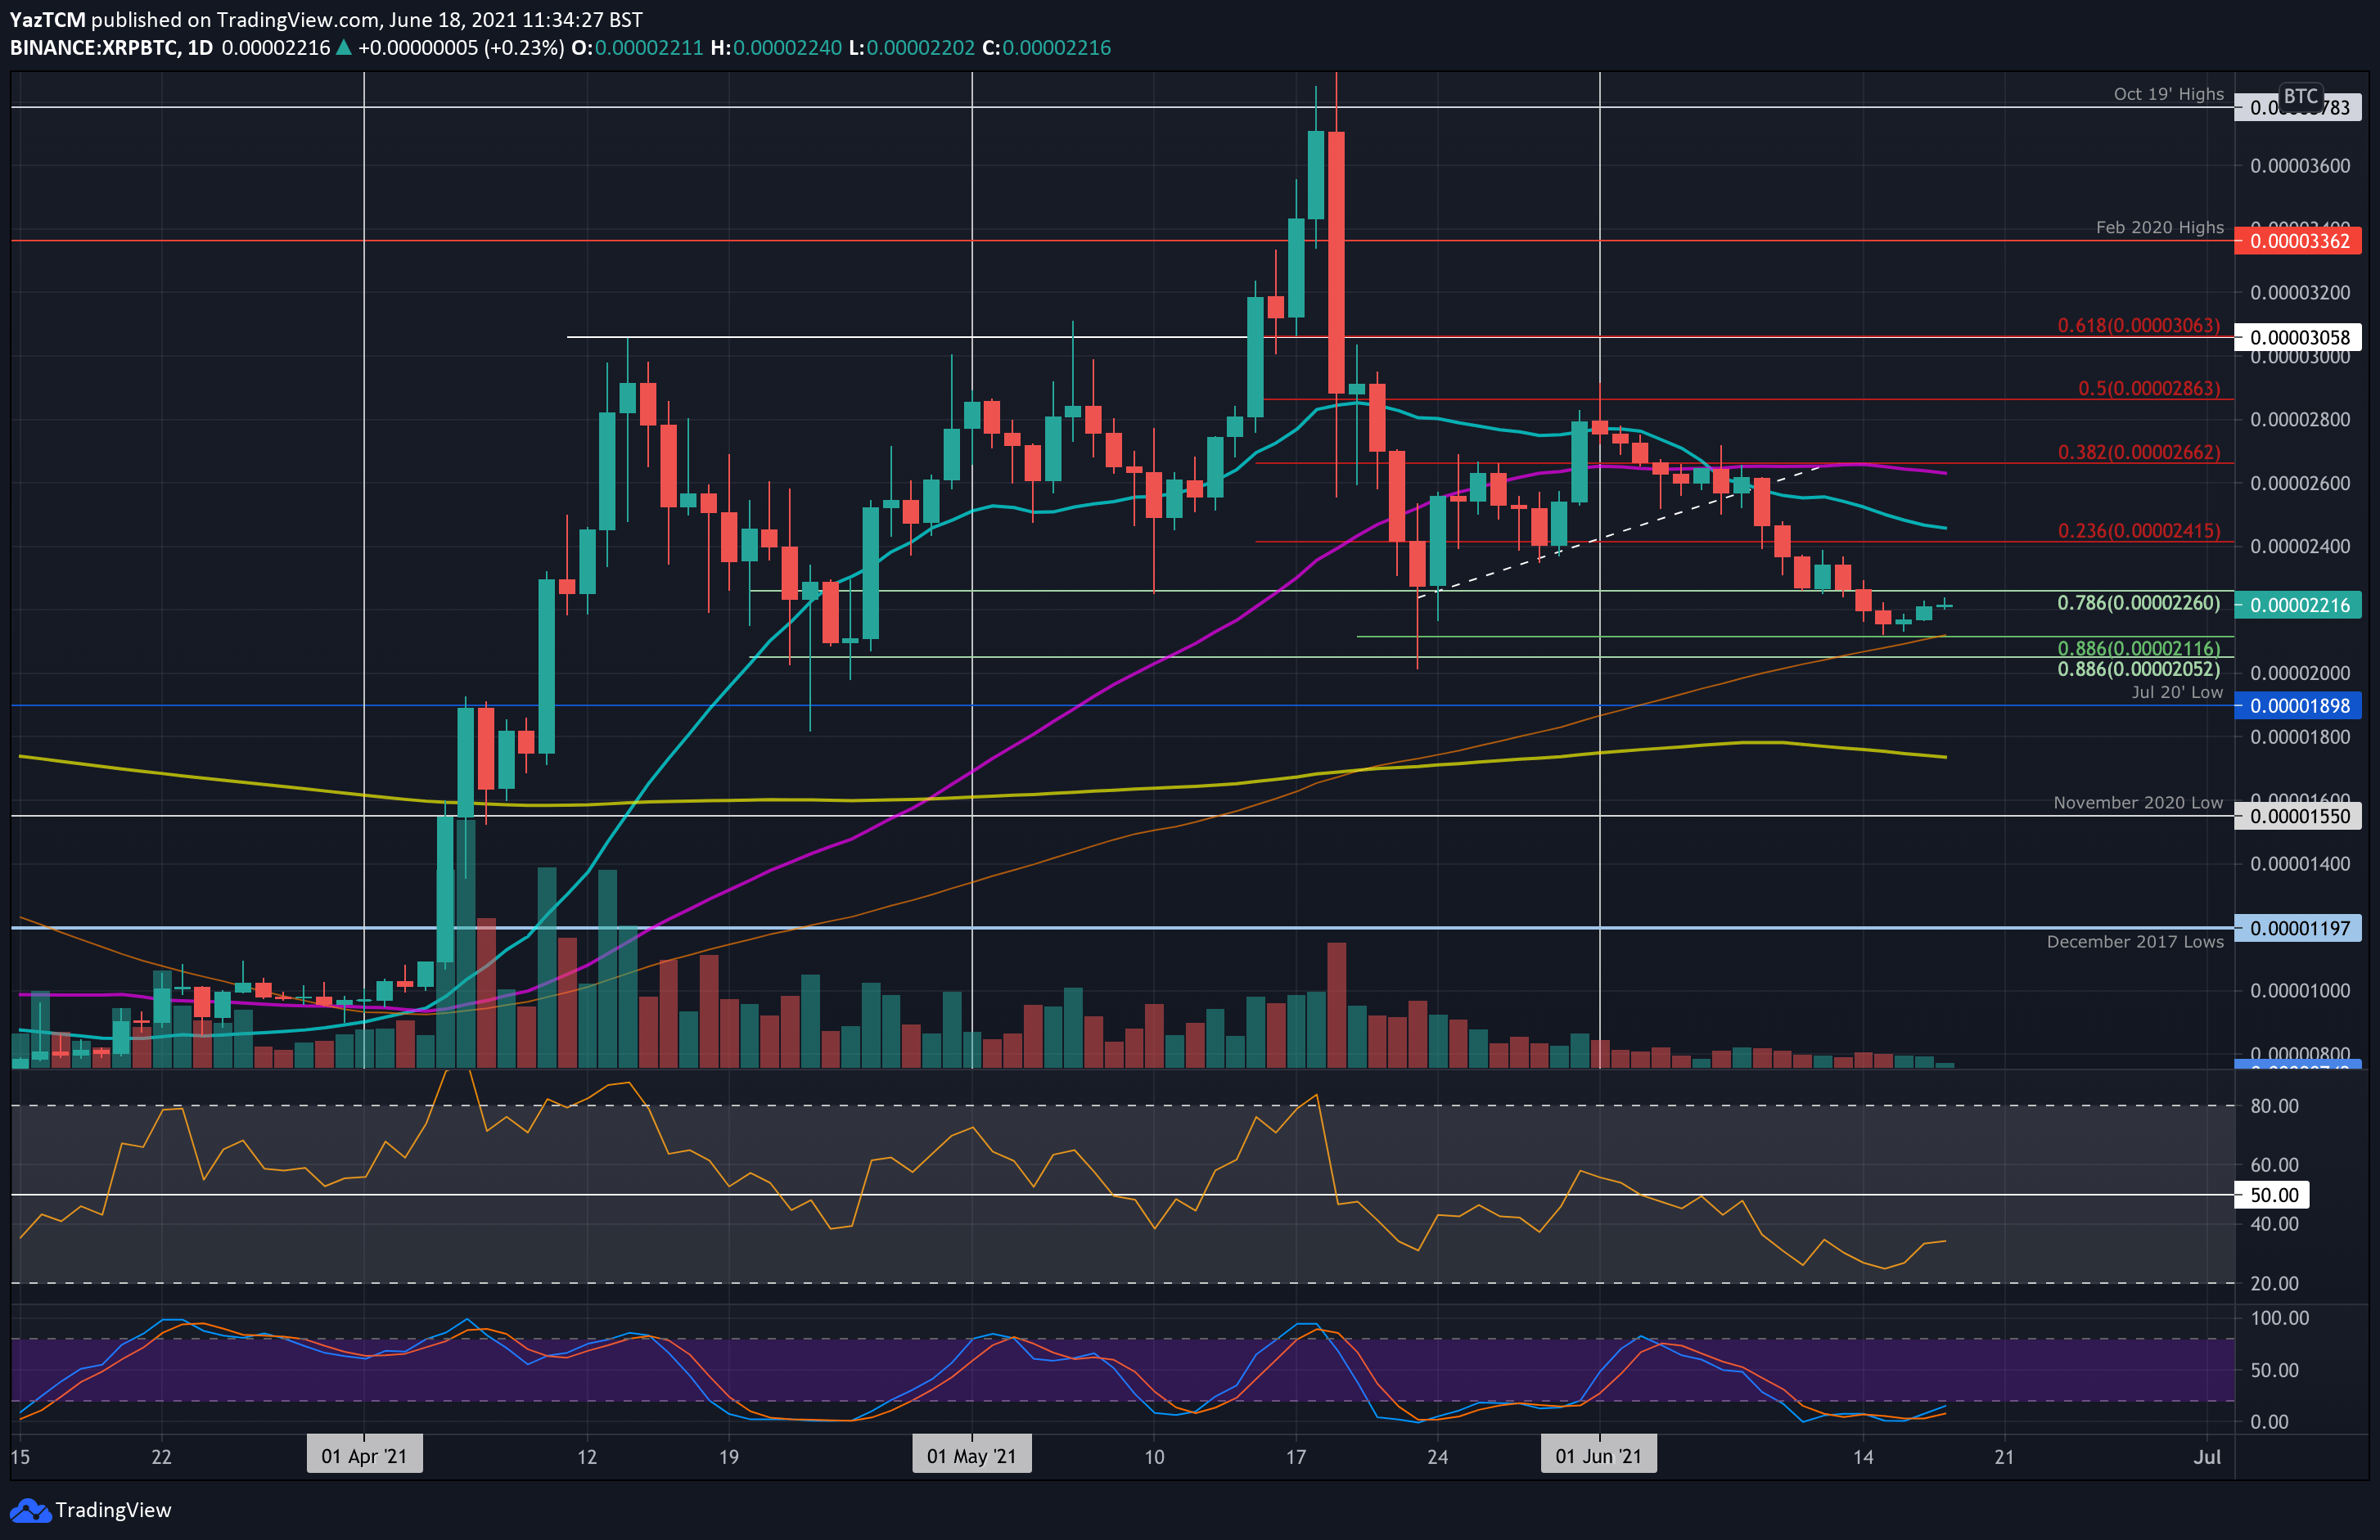
Against bitcoin, XRP has been in a consistent downtrend since the beginning of the month after failing to break above the 20-day MA at 2800 SAT.
It fell beneath critical support at 2260 SAT (.786 Fib) at the start of the week and continued to dip until support was found at 2115 SAT (short term .886 Fib). It rebounded from there and is back above 2200 SAT today.
Looking ahead, the first resistance lies at 2415 SAT (bearish .236 Fib & 20-day MA). This is followed by 2660 SAT (bearish .382 Fib & 50-day MA), 2853 SAT (bearish .5 Fib), and 3000 SAT.
On the other side, if the sellers push lower, the first support lies at 2115 SAT (100-day MA). This is followed by 2000 SAT, 1900 SAT (Jul 2020 low), and 1750 SAT (200-day MA).
Cardano
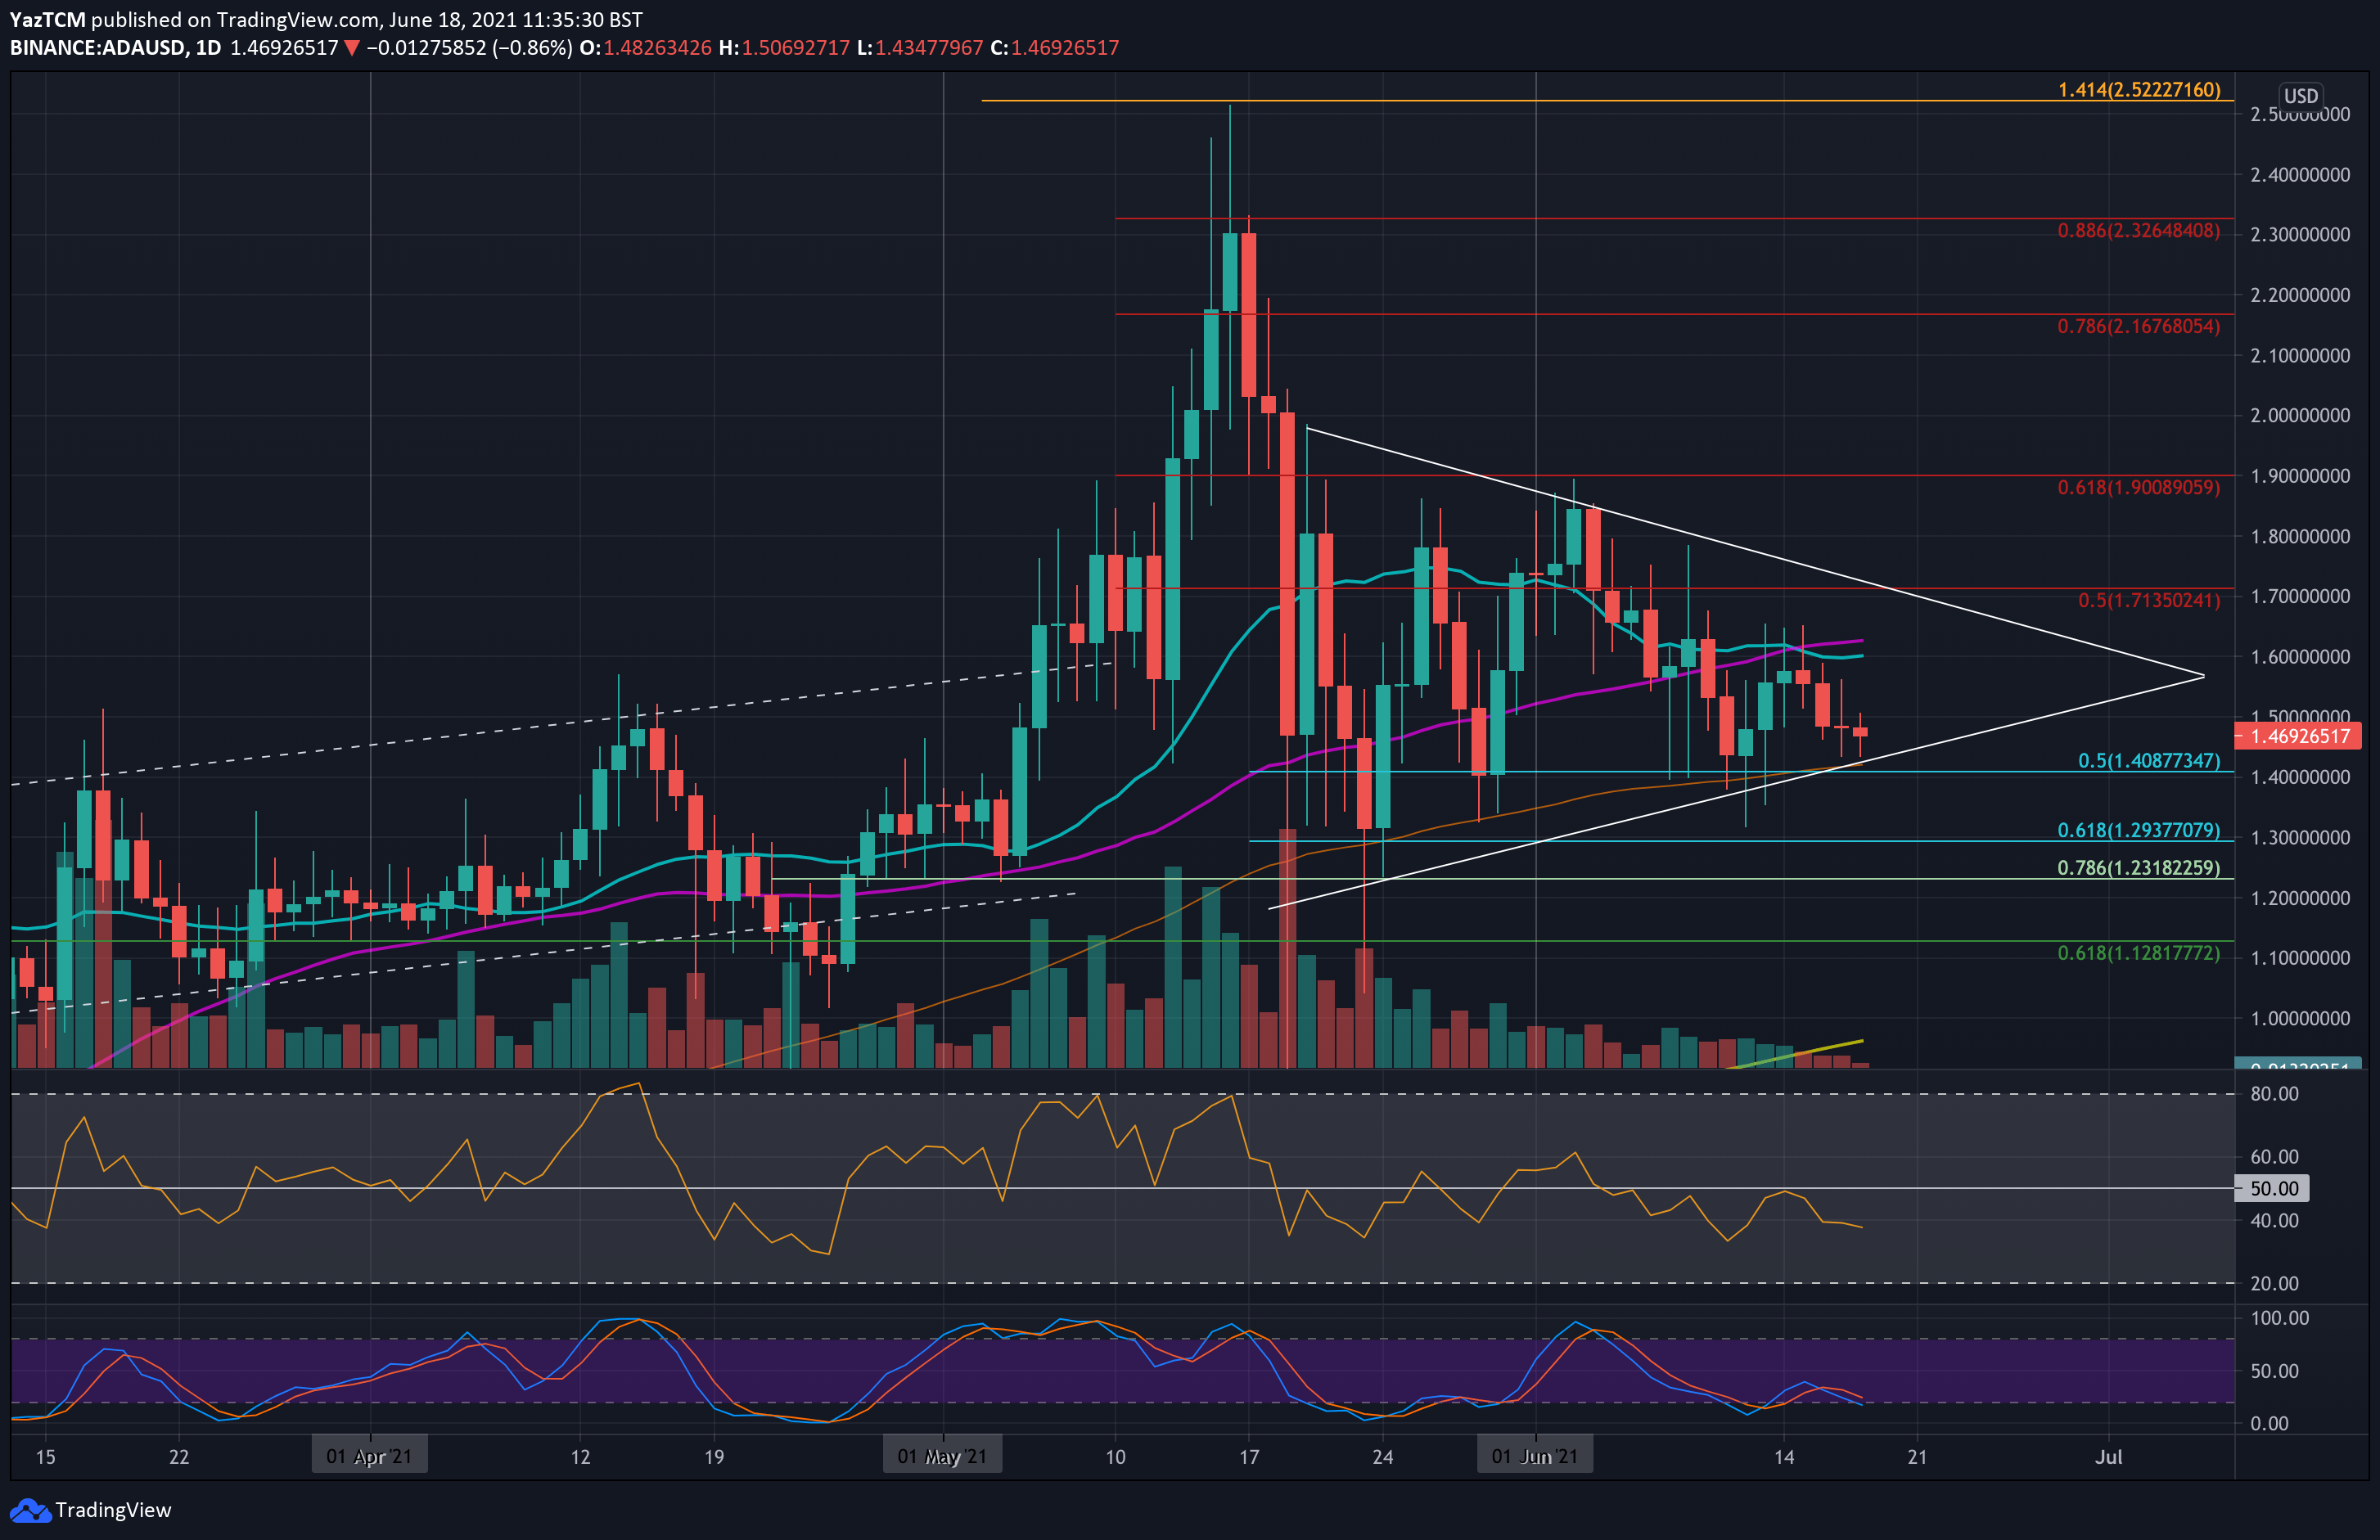
ADA is down 3% this week as the coin currently trades at $1.46. The cryptocurrency found support at $1.40 (100-day MA) at the beginning of the week and started to push higher. Unfortunately, it could not overcome resistance at the 20-day MA at $1.60 on Wednesday and started to head lower from there.
ADA is actually trading inside a symmetrical triangle pattern and tested the lower boundary of the pattern today.
Looking ahead, the first support lies at $1.40 (lower triangle boundary, 100-day MA, & .5 Fib). Beneath this, support lies at $1.30 (.618 Fib), $1.23, and $1.20.
On the other side, the first strong resistance lies at $1.50. This is followed by $1.60 (20-day & 50-day MA), $1.71 (bearish .5 Fib & upper boundary of triangle), and $1.80.
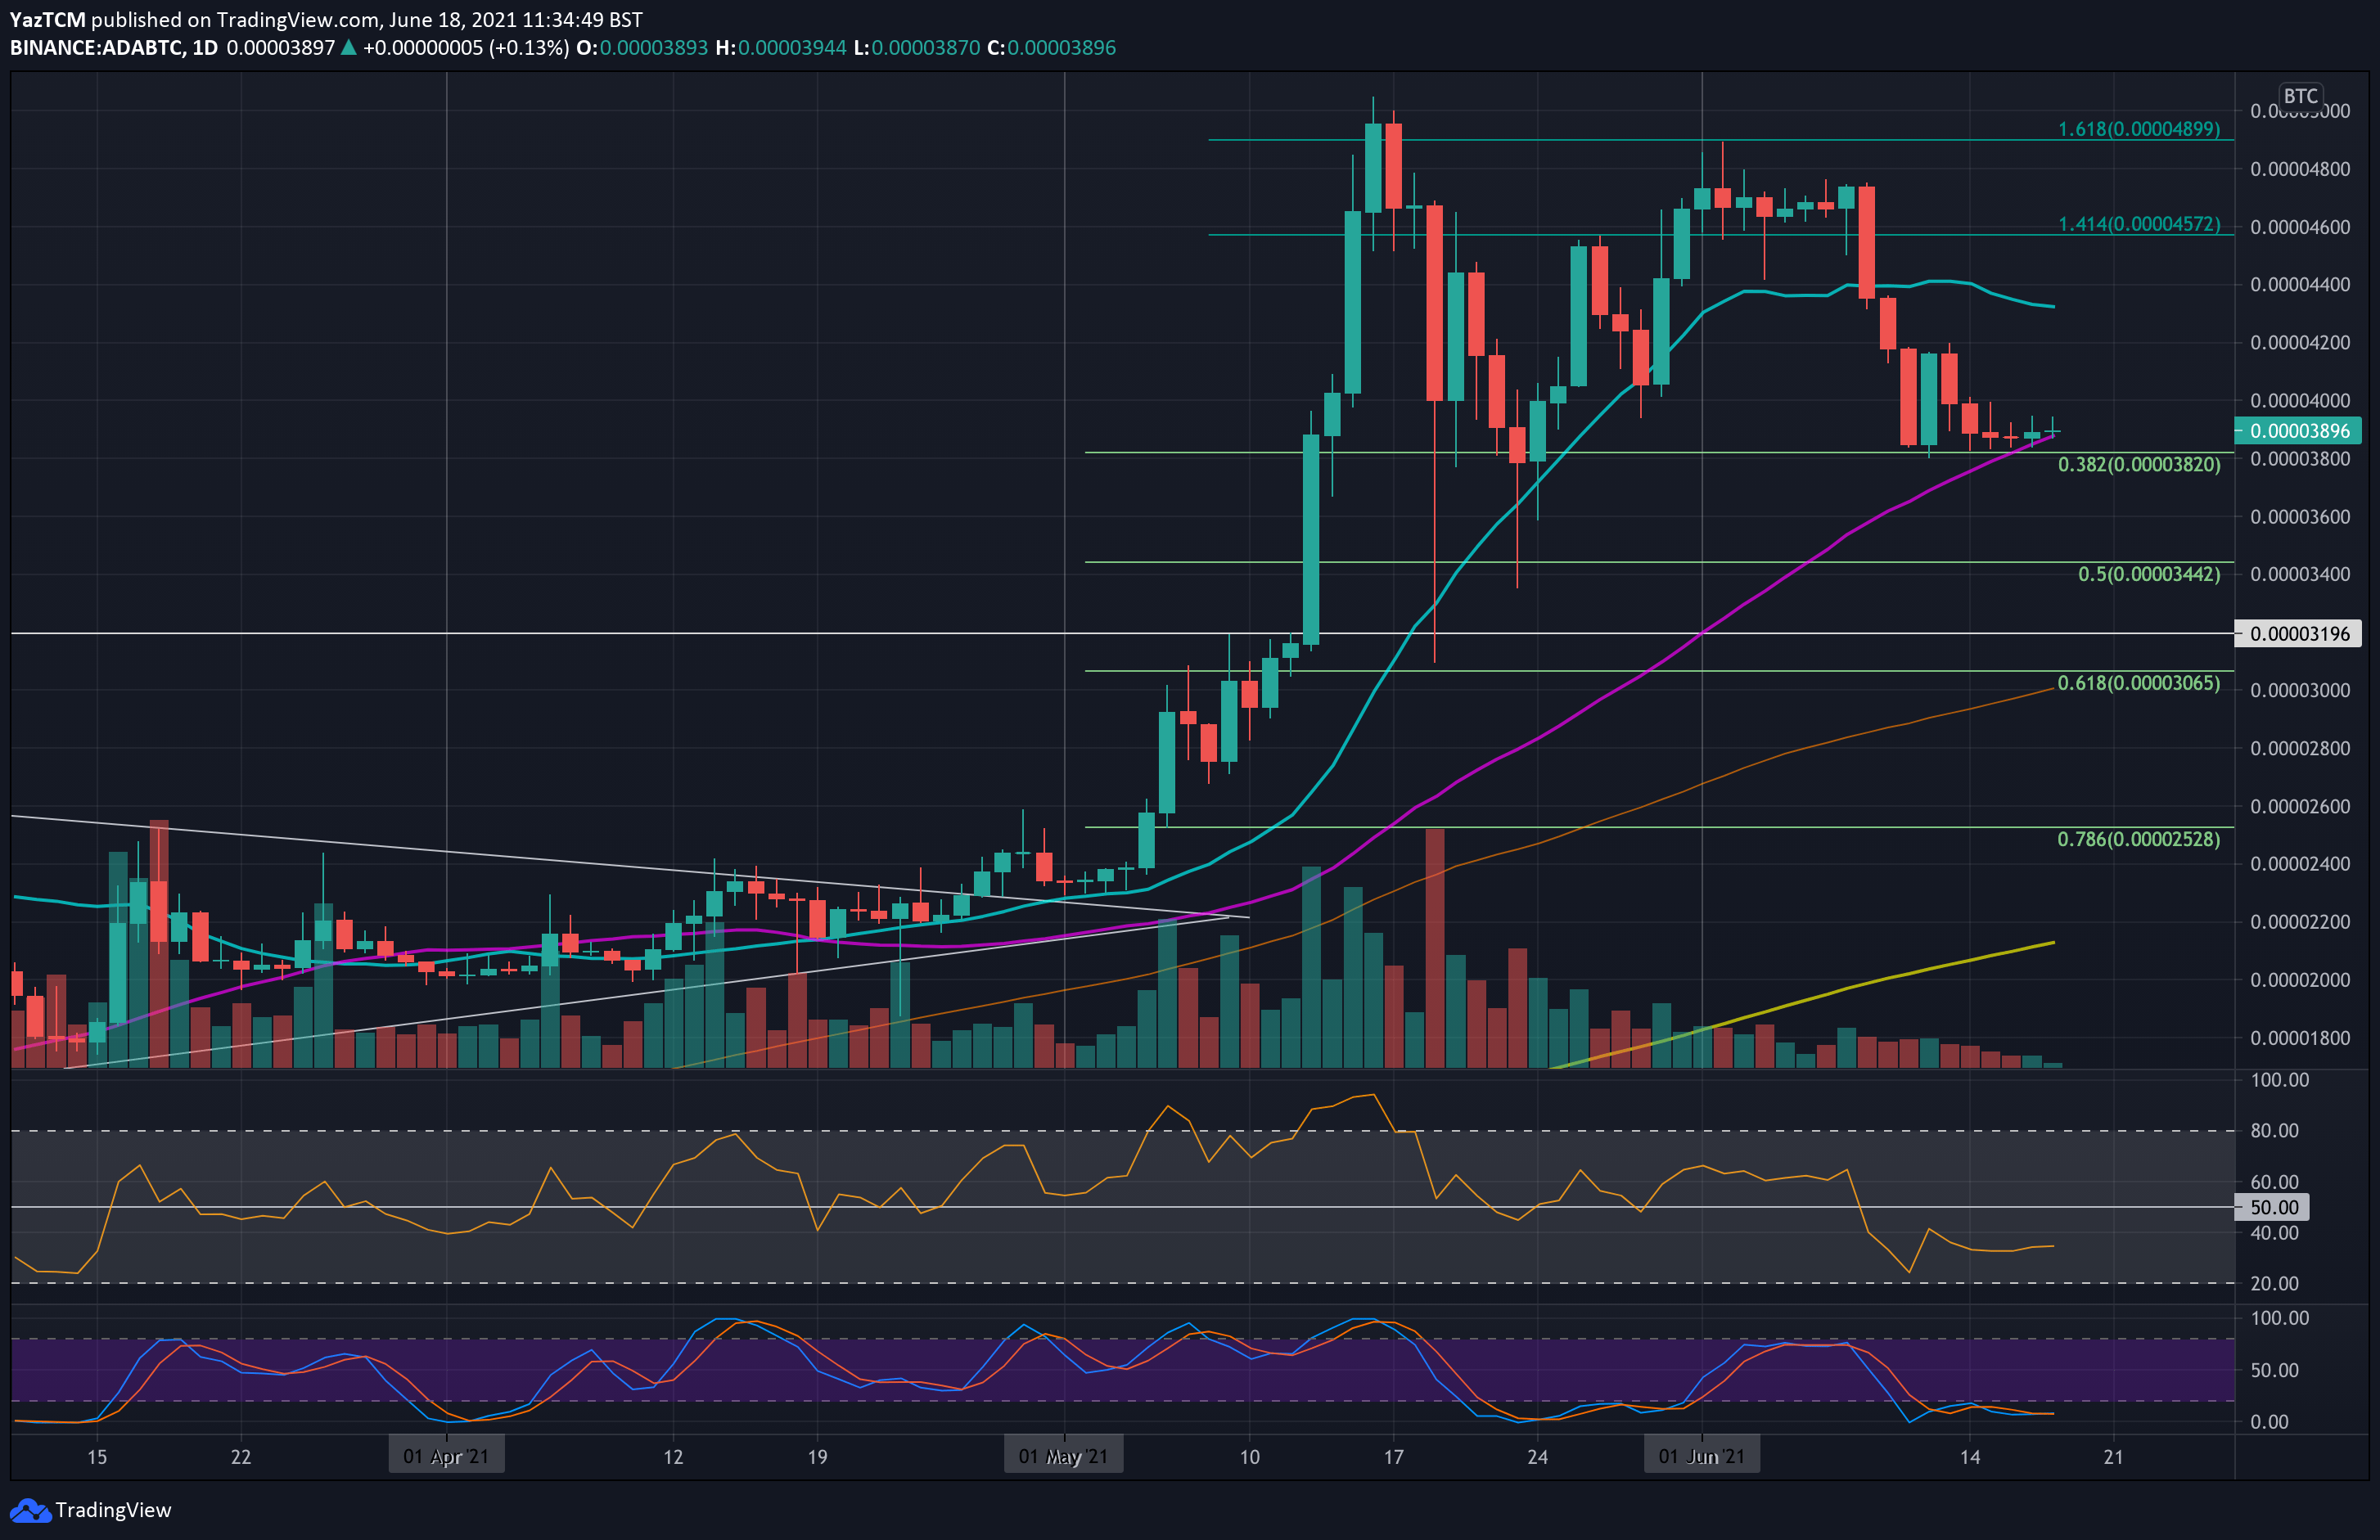
ADA is currently trading at the 50-day MA against BTC. The coin had found support last week at 3820 SAT (.382 Fib) and attempted to push higher but could never overcome the resistance at 4200 SAT.
It started to head lower from 4200 SAT this week until returning to the 3820 SAT support.
Looking ahead, the first resistance lies at 4000 SAT. This is followed by 4300 SAT (20-day MA), 4570 SAT (1.414 Fib Extension), 4800 SAT, and 4900 SAT (1.618 Fib Extension).
On the other side, the first support lies at 3820 SAT (50-day MA & .382 Fib). This is followed by 3600 SAT, 3440 SAT (.5 Fib), 3200 SAT, and 3000 SAT (200-day MA).
Solana
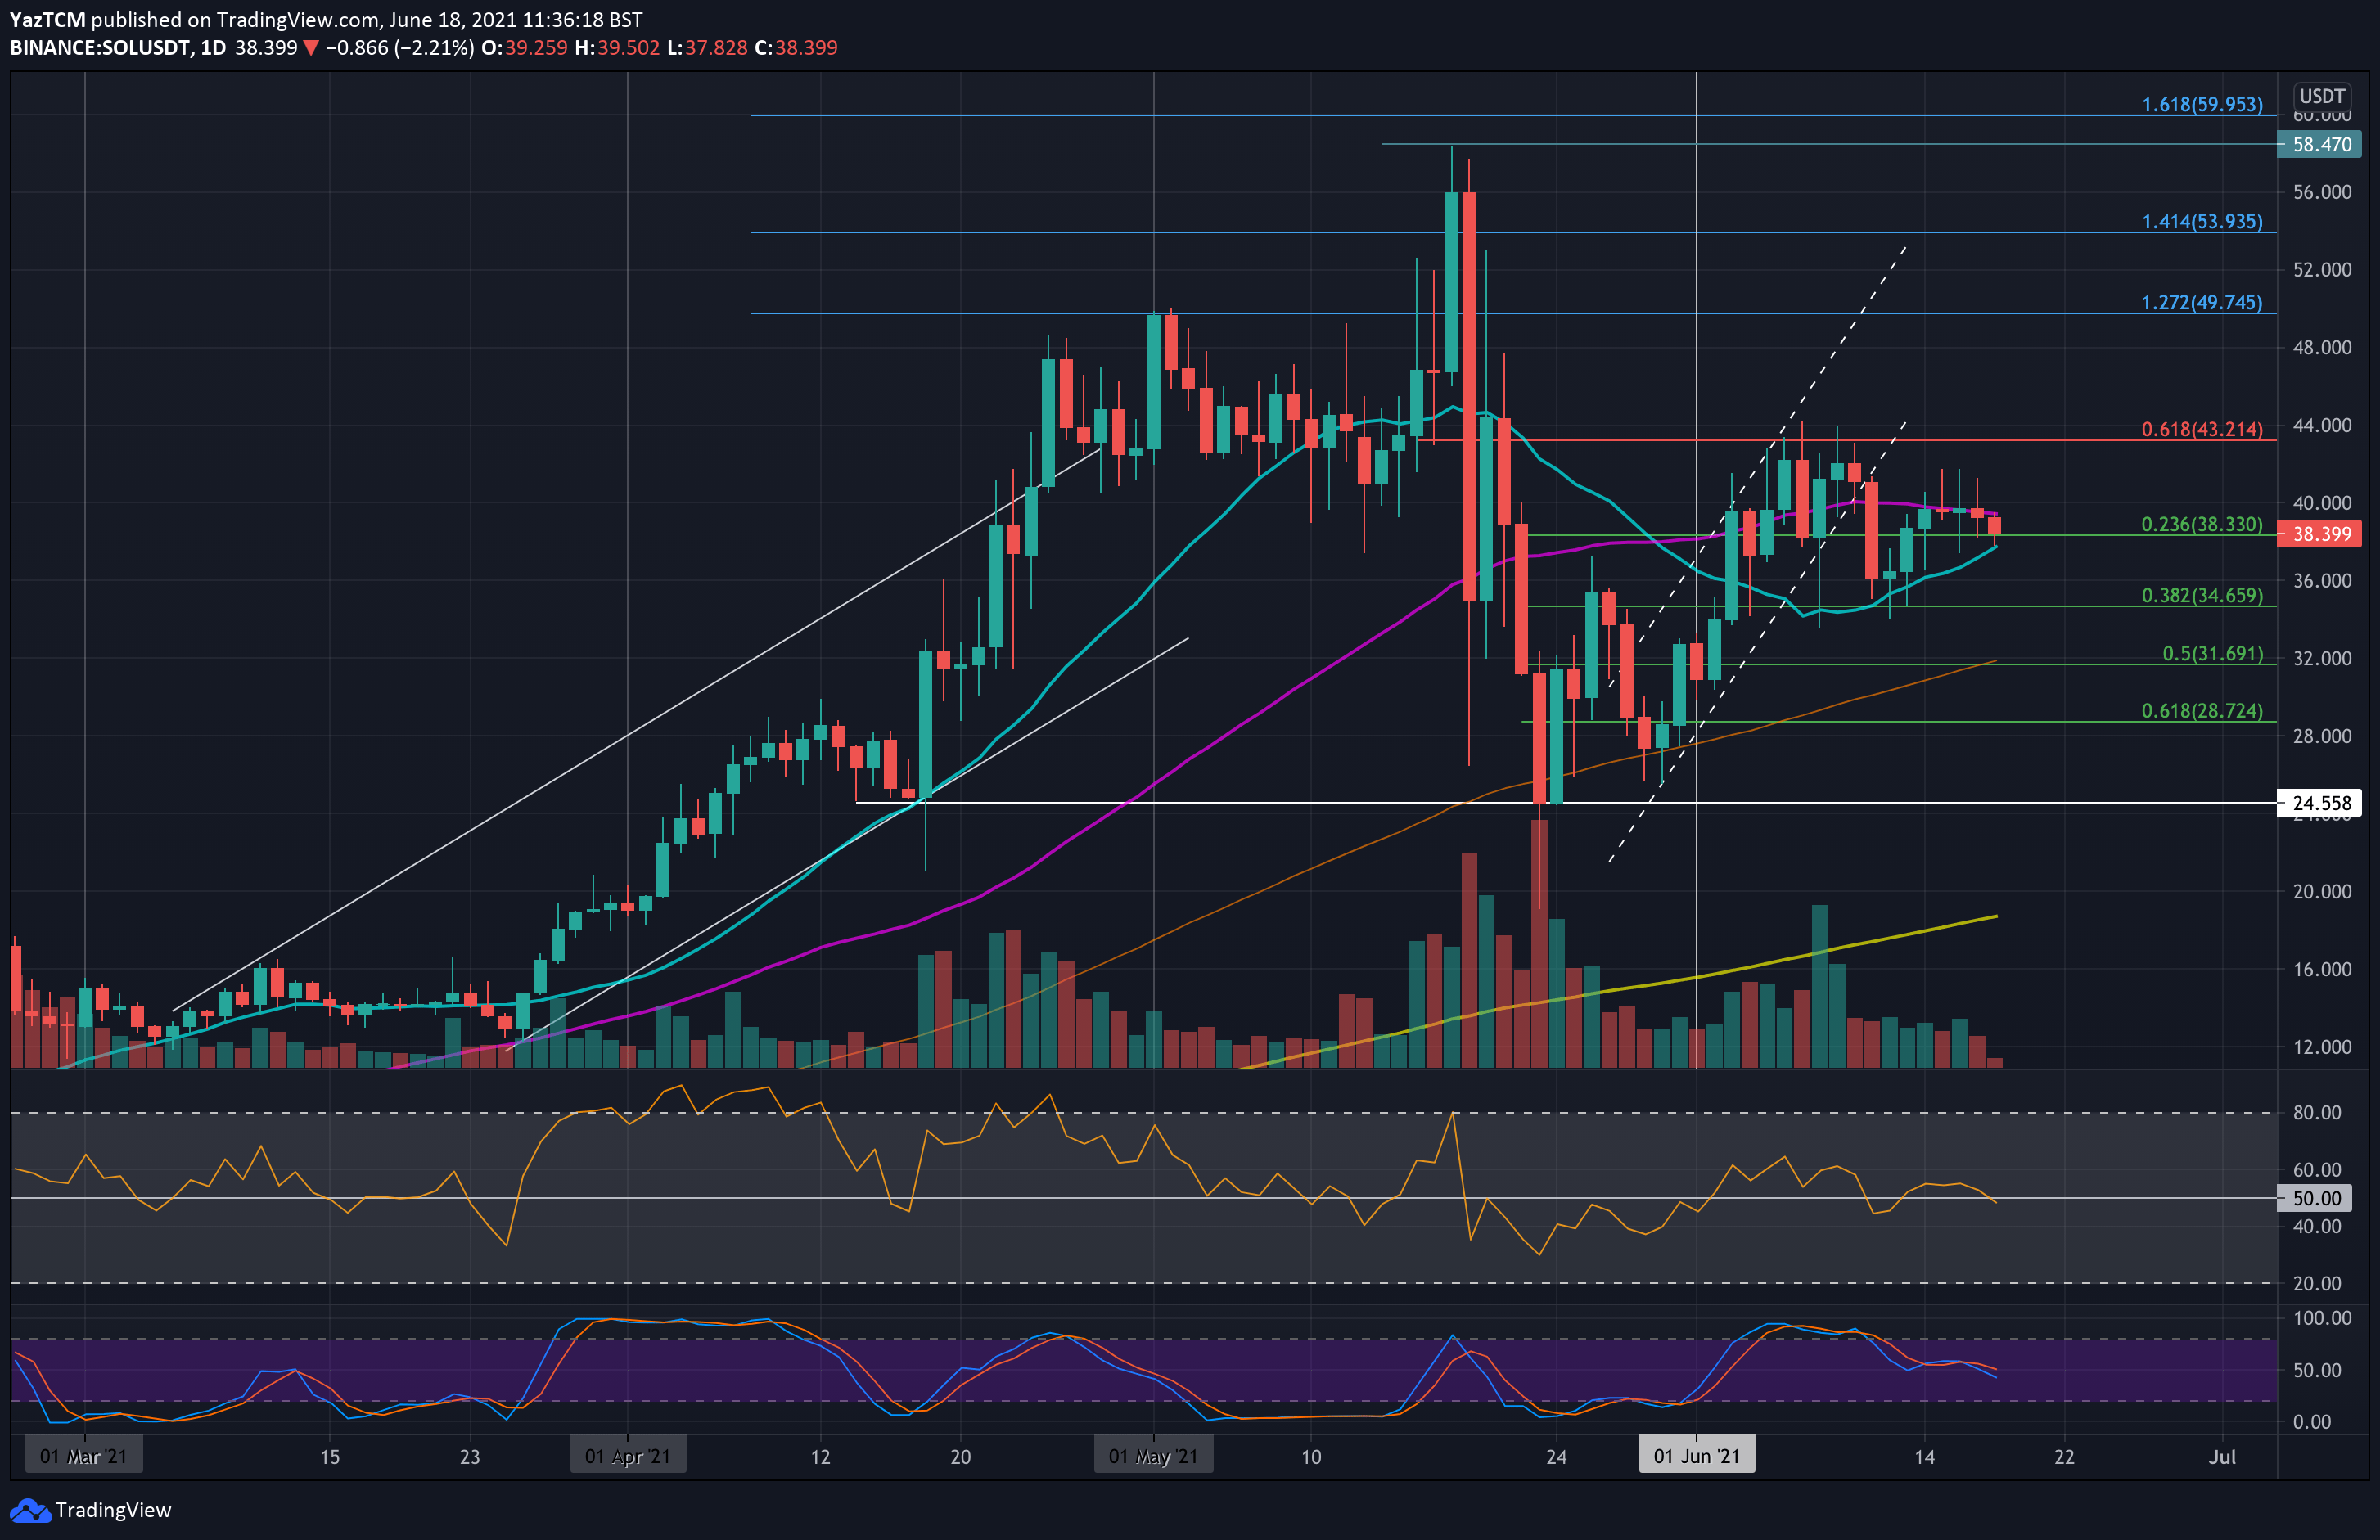
Solana is down by 6.5% this week as it currently trades at $38.40. The cryptocurrency rebounded from support at $36 at the beginning of the week as it started to push higher.
It did manage to spike above $40 throughout the week but could never close a daily candle above the resistance there, provided by a 50-day MA level. It has since dropped into the 20-day MA today at $38 but has since recovered above $38.33 (.236 Fib).
Looking ahead, the first resistance lies at $40 (50-day MA). This is followed by $44 (bearish .618 Fib), $48, and $50 (1.272 Fib Extension).
On the other side, the first support lies at $38.40 (.236 Fib). This is followed by $36, $34.66 (.382 Fib), $32 (100-day MA & .5 Fib), and $28.72 (.618 Fib).
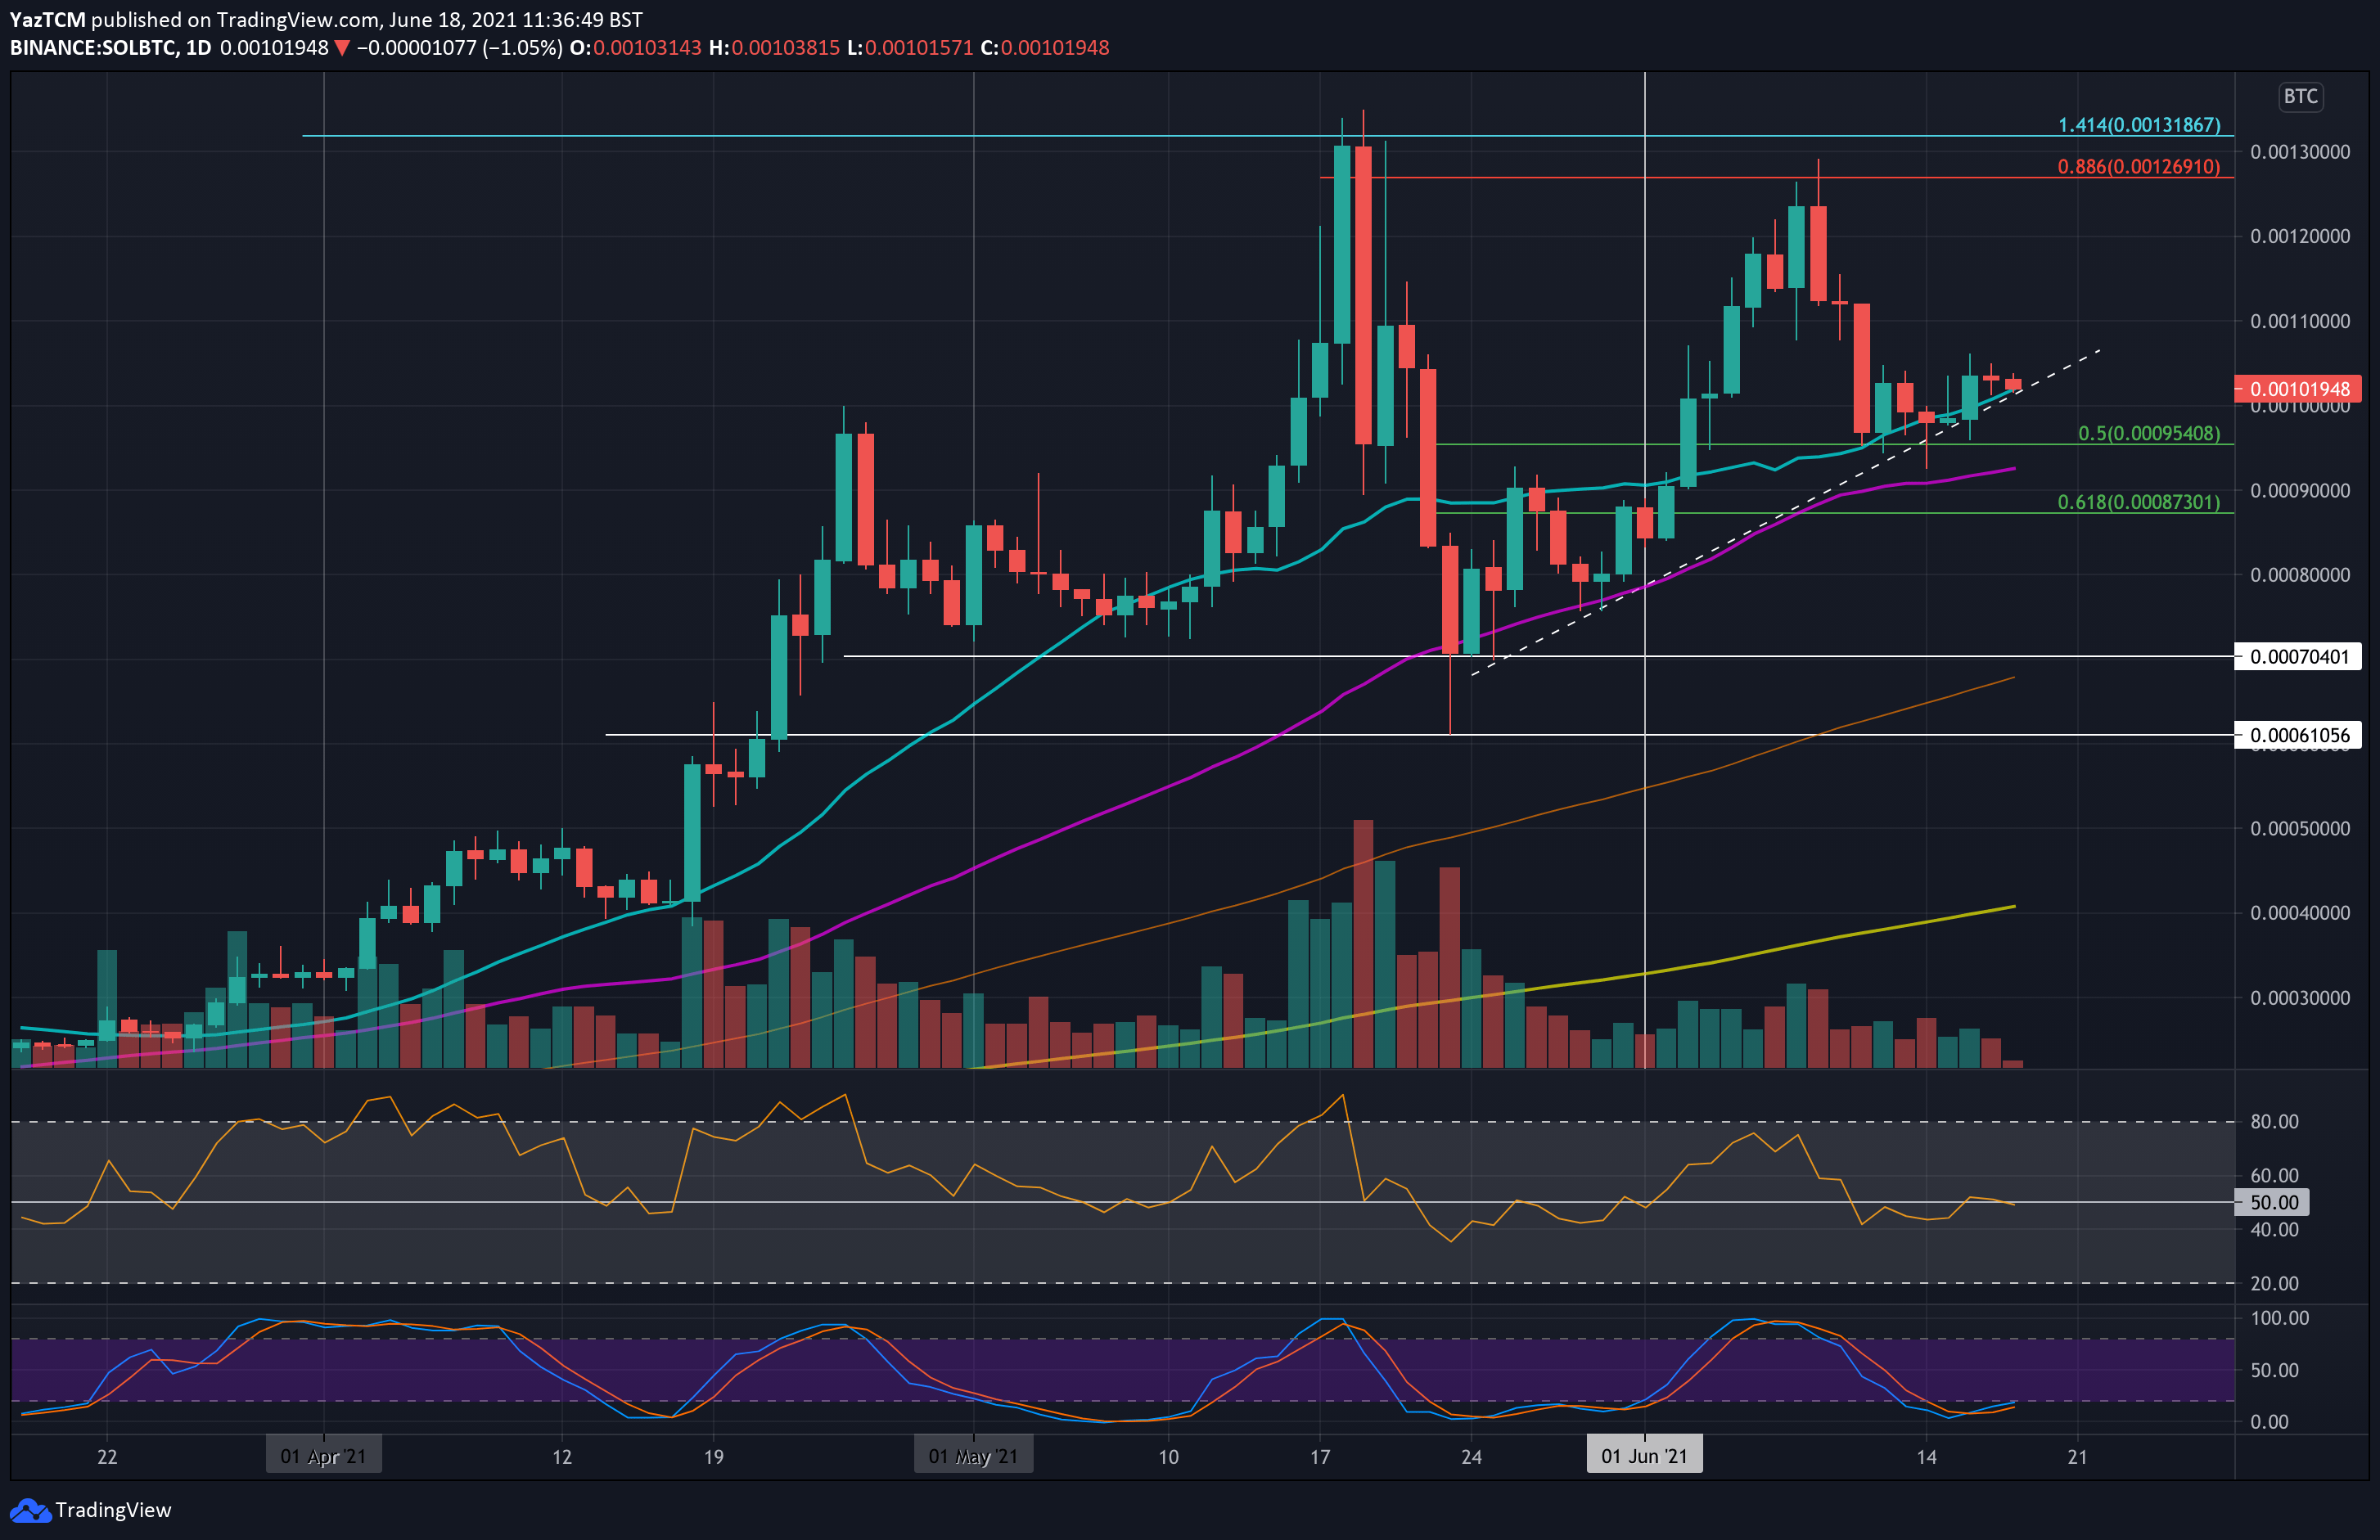
Against BTC SOL found support at 0.00095 BTC (.5 Fib) at the start of the week and started to push higher from there. On Wednesday, it managed to break above 0.001 BTC as it pushed above the 20-day MA.
SOL is also trading above a rising trend line as it attempts to defend it and the 20-day MA level today.
Looking ahead, the first strong resistance lies at 0.0011 BTC. This is followed by 0.0012 BTC, 0.00127 BTC (bearish .886 Fib), 0.00131 BTC (1.414 Fib Extension), and 0.00135 BTC.
On the other side, the first support lies at the rising trend line and the 20-day MA, around 0.001 BTC. Beneath this, support lies at 0.00095 BTC (.5 Fib), 0.00092 BTC (40-day MA), and 0.000873 BTC (.618 Fib).