- Theta fuel price has risen by an overall 102% since the beginning of June and is currently trading at a low of 17% from its ATH
- The current price of TFUEL is $0.54 established on the back of a 6.4% increase in the past 24 hours
- Meanwhile, the TFUEL/BTC pair is trailing at 0.00001336 BTC with a loss of 6.59% at press time
While most of the crypto assets erased nearly 50% of their gains as a consequence of May’s flash crash, Theta Fuel evolved to become the third top 100th cryptocurrency to set an ATH since the May 19th liquidation escape.
The 102% surge was immediately accompanied by a pullback that spawned the price of TFUEL to grab support above the 50 EMA.
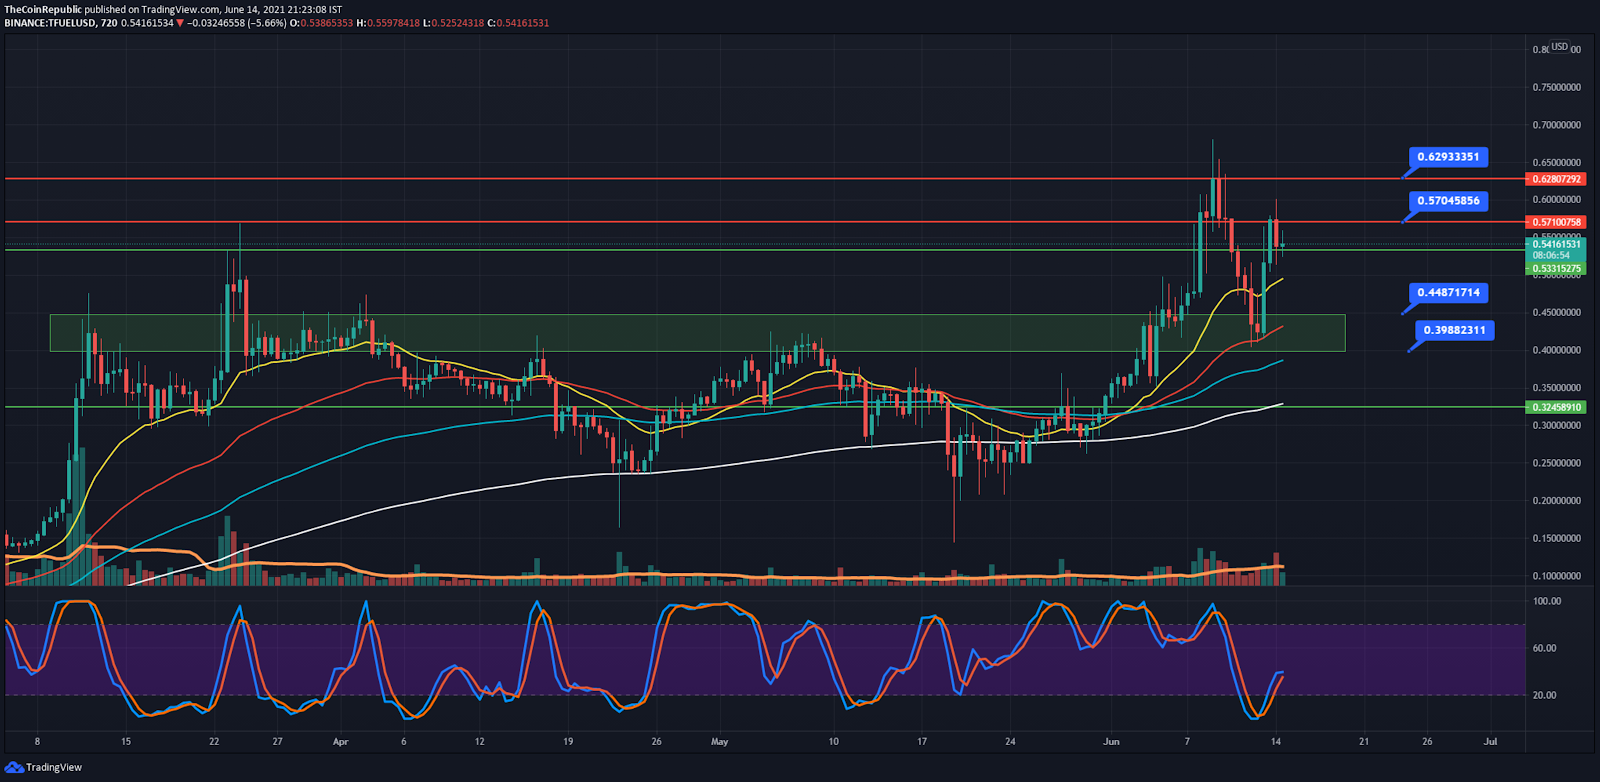
However, TFUEL kickstarter this week by rallying another 42% and is presently exhibited indecision as evidenced by the Doji candlestick on the 12-hour chart. A rejection from the $0.57 level resulted in an interruption in the bullish streak of TFUEL.
For the day ahead: Presently TFUEL is trading above the pivotal support of $0.53 which highlights that more gains are anticipated ahead. Even so, the failure of the token to sustain above that level can lead to the price catching up with the 20 EMA. On the downside, considering that the bearish streak continues, TFUEL can expect the 50 EMA to save the day. The occurrence of this scenario will validate the double top pattern.
On the contrary, the success of TFUEL to breach the overhead resistance of $0.54 will guarantee higher highs in the near term.
The stochastic RSI on the 12-hour chart is on the verge of transpiring a bearish cross. The event of a %K line moving below the %D line will enable TFUEL to bounce off from the critical EMAs
According to the coinmarketcap website, TFUEL is currently ranked #39th while enjoying a market dominance of 0.17%.
TFUEL Price Chart on the 4-hour time frame
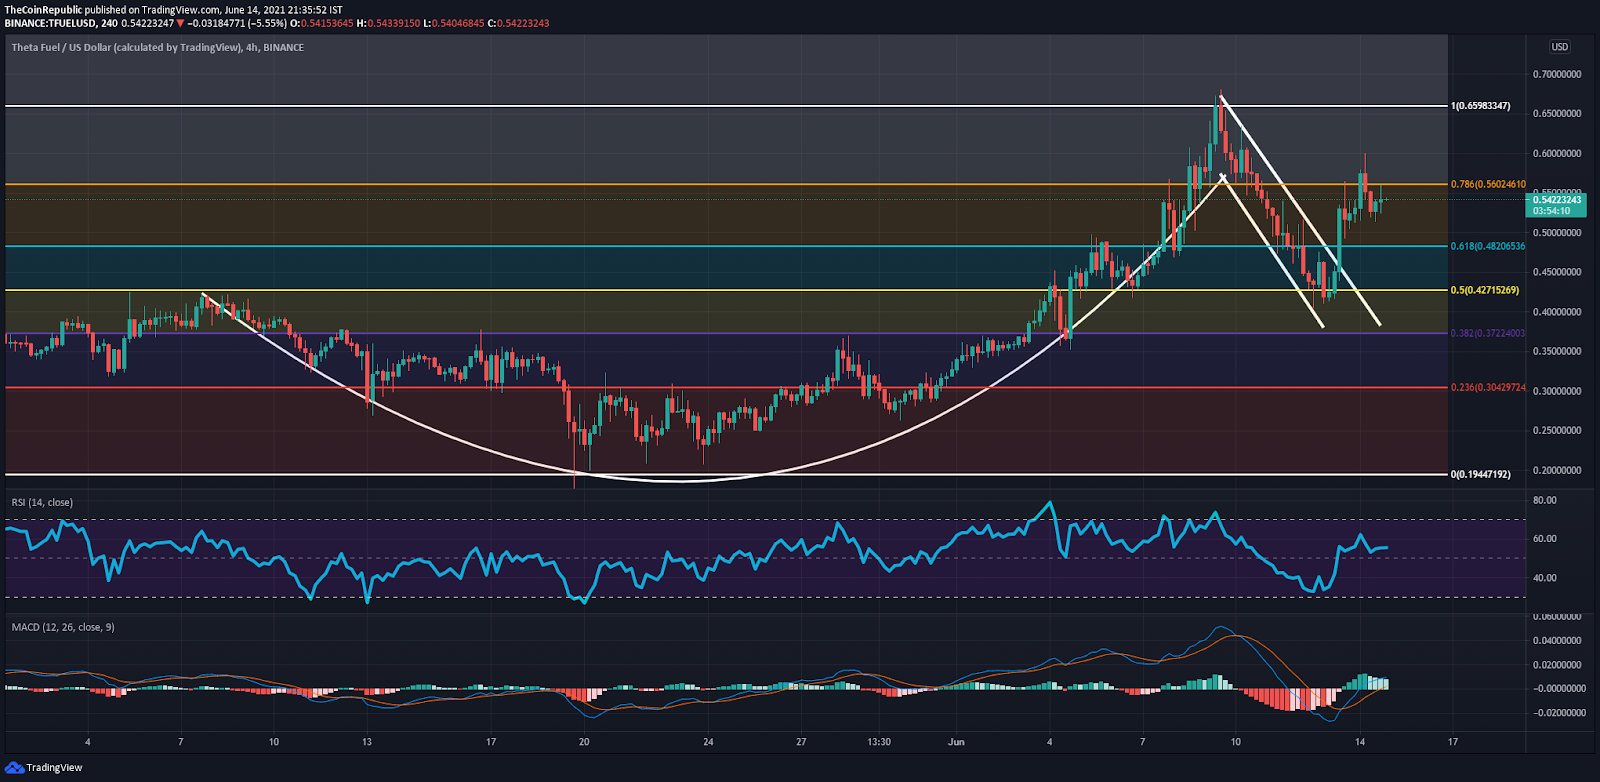
The 4-hour technical chart of TFUEL forecasts the continuation of the bull cycle as evidenced by the bullish crossover on the MACD. The indecision in the market has caused the histogram to decline. An ideal situation would be to witness the MACD line and signal line making higher highs inside the positive territory.
Until now. TFUEL is facing tremendous pressure to get above the bearish 0.786 FIB retracement at $0.56. Since there is no signal of bearish divergence ahead, it is expected that the token continues to trade above the critical EMAs.
As displayed on the above chart, TFUEL sparked a bull rally after smashing right through the handle of the cup & handle pattern. With Bitcoin exploring the $40,000 resistance, it wouldn’t be bizarre to expect TFUEL to hit the $0.94 (FIB 1.618) also considering that the launch of Theta Mainnet 3.0 is only two weeks away.
SUPPORT : $0.44, $0.39
RESISTANCE : $0.57, $0.62