The Cardano price analysis suggests a strong bullish trend for today as the price has improved significantly in the last 24 hours as the bulls are continuing to rule the market for ADA despite the cryptocurrency giants like Bitcoin and Ethereum still under bearish pressure. The past week proved extremely profitable for Cardano as the price levels recovered significantly and have now reached the $0.648 range.
Further improvement in price value can be expected as the cryptocurrency price is now touching $0.648 after the recent bullish push, and the coin seems to be getting out of the major downtrend.
ADA/USD 1-day price chart: Bullish trend escalates, marking higher gains
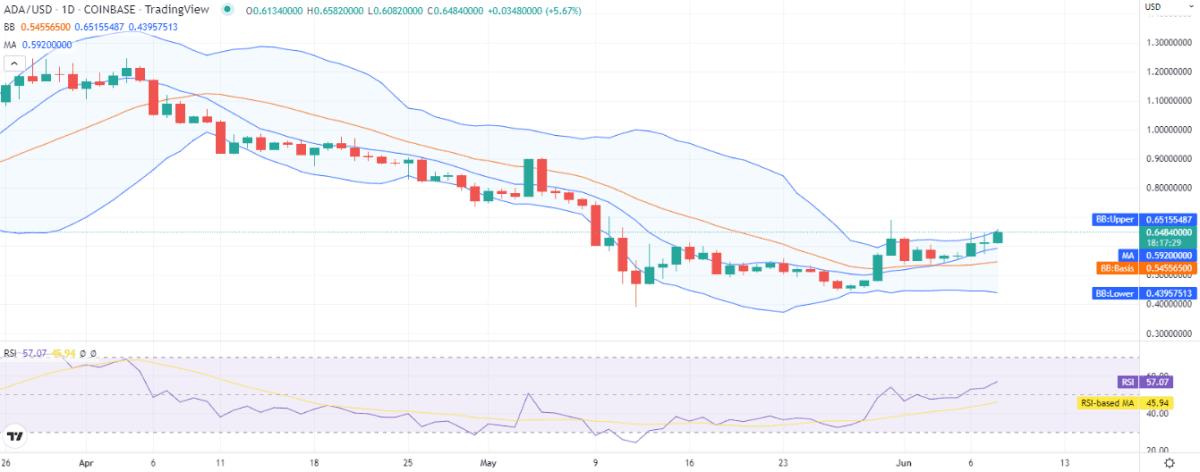
The one-day Cardano price analysis predicts a supposedly stronger bullish trend for the day as the price covered range upwards. Although the bulls were in the lead, the bullish momentum has escalated today as the price touched the $0.648 level. The crypto pair reports an increase of value amounting to 10.06 percent for the last 24 hours, and due to the uptrend of the past week, the coin also reports an increase in value by 7.27 percent over the course of the past seven days. The moving average (MA) is also trading on an upwards line and is present at $0.592 above the SMA 50 curve.

The volatility is increasing again. Nonetheless, the Bollinger Bands Indicator suggests the following values for the day; the upper Bollinger band value is now $0.651 representing the resistance, whereas the lower Bollinger band value is $0.439 representing the support for ADA. The Relative Strength Index (RSI) score has also been increasing for the past few days, and the indicator has reached index 57; the upwards curve of the indicator hints at the buying activity of the ADA assets.
Cardano price analysis: Recent developments and further technical indications
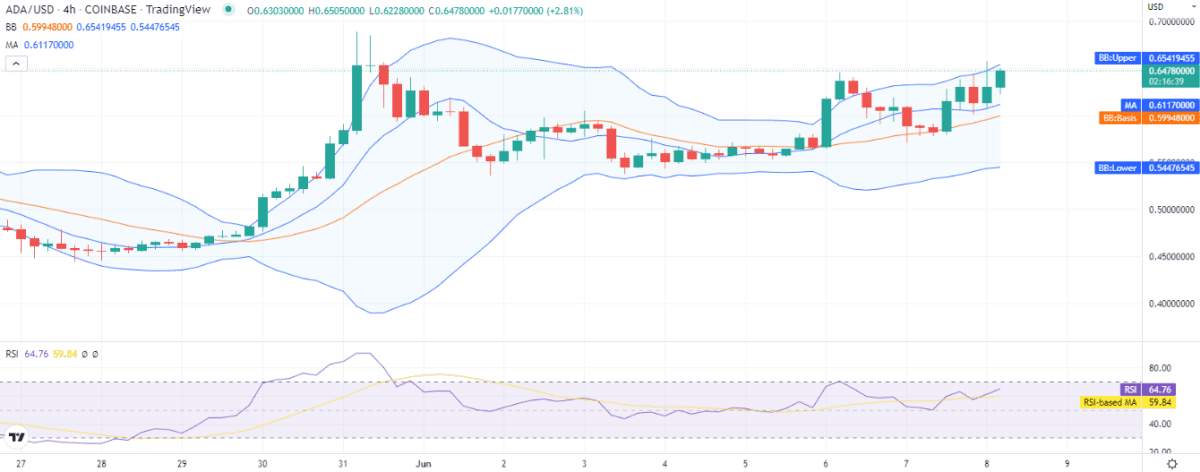
The 4-hour Cardano price analysis shows the bulls have made a significant comeback in the last few hours, as the price has made a sudden spike, although the previous hours were also supportive for the bulls as the price has been increasing. The situation favors the buyers, as the price has now increased to $0.648. If we discuss its moving average value, then it is resting at the $0.611 position for now.

The volatility is increasing as the Bollinger bands cover more area, which means that the bulls might continue ruling in the upcoming hours. The upper limit of the Bollinger Bands Indicator is now at $0.654, whereas its lower limit is present at $0.544. The RSI curve is in the neutral zone but is moving towards the overbought region as the score has increased up to 64, and the indicator’s curve is still upwards.
The past few weeks have been beneficial for the cryptocurrency’s progress, as a constant uptrend is controlling the market. This is why the technical indicators for Cardano price analysis predict a buying trend. We can see that six indicators are on the selling side, whereas 10 indicators are on the buying while 10 indicators are standing neutral.
Cardano price analysis: conclusion
The daily and hourly Cardano price analysis is pointing in the bullish direction today, as the price has undergone an increase. Green candlesticks have returned to the one-day price chart, indicating an upward trend for the market. The price has increased significantly in the last four hours as well as the market value of the coin is now touching $0.648; and it can be expected that the uptrend will prolong in the future.
Disclaimer. The information provided is not trading advice. Cryptopolitan.com holds no liability for any investments made based on the information provided on this page. We strongly recommend independent research and/or consultation with a qualified professional before making any investment decisions.
 cryptopolitan.com