Neo price analysis indicates NEO prices have been on a bullish trend for the last 24 hours. The prices have seen a price surge of 2.27 percent as the prices trade in a range-bound of between $10.92 to $11.30. The 24-hour trading volume registered is $69,519,469.02, and the market capitalization is at $787,600,454.40. The intraday high was seen at $11.30, and the intraday low was seen cheaper at $10.92. The bulls have been in control of the market as they push the prices up to new highs.
Neo price analysis: Technical analysis
Neo price analysis shows NEO prices have been trading along an ascending support line. The NEO prices are testing the ascending support line for the second time, and a breakout is expected. The relative strength index indicator is currently at 54 percent, which indicates that the market is in neither overbought nor oversold conditions. The MACD indicator shows that the NEO prices are in a bullish crossover as the signal line crosses over the MACD line as the Parabolic SAR indicator.

NEO prices are expected to continue on a bullish trend as the bulls push the prices up to new highs. The next resistance levels for NEO are seen at $12.0, and a breakout is expected. The Relative Strength Index indicator is currently at 54 percent, which indicates that the market is in neither overbought nor oversold conditions, which is a good sign for the bulls.
NEO price analysis on a 4-hour price chart: Bulls in control
Neo price analysis on the 4-hour price chart shows that NEO prices have been on a bullish trend as they made higher highs and higher lows. The prices are currently trading above the moving averages which indicates that the bulls are in control of the market. The RSI indicator is currently at 54 percent, which indicates that the market is in neither overbought nor oversold conditions. The MACD indicator is currently in a bullish crossover as the signal line crosses over the MACD line.
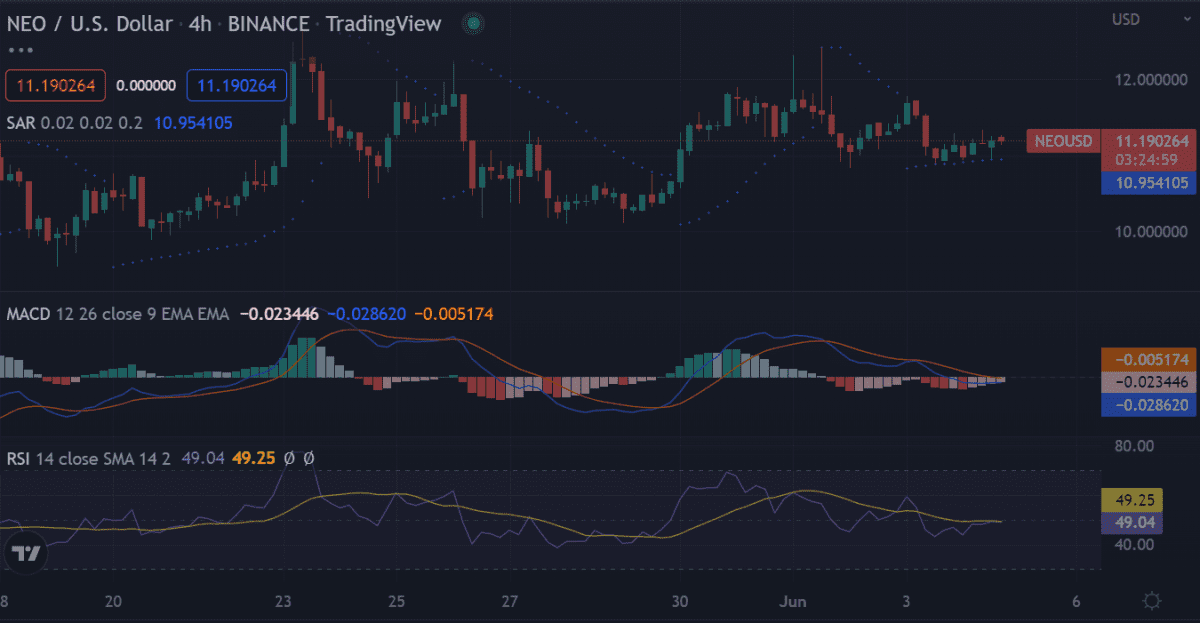
The NEO prices are expected to continue on a bullish trend as the bulls push the prices up to new highs. The next resistance levels for NEO are seen at $12.0, and a breakout is expected. The Parabolic SAR indicator is currently at $10.92, which is a good sign for the bulls.
NEO price analysis conclusion
Neo price analysis indicates the market is currently in a bullish sentiment after a brief buying pressure from the $9.8 support level. The market is expected to continue on a bullish trend as the bulls push the prices up to new highs. The next resistance levels for NEO are seen at $12.0, and a breakout is expected. The technical indications show the market is in a good condition for the bulls.
Disclaimer. The information provided is not trading advice. Cryptopolitan.com holds no liability for any investments made based on the information provided on this page. We strongly recommend independent research and/or consultation with a qualified professional before making any investment decisions.