
$AMP price shows a falling channel pattern in the 4-hour chart that may shortly result in the fallout of $0.011 and result in a retracement to $0.010. Key technical points:
- The $AMP market value decreased by 0.73% today at press time.
- The price action shows a falling channel in action.
- The 24-hour trading volume of $AMP is $10.89 Million, indicating a drop of 16.95%.
Past Performance of $AMP
The sharp V-shaped reversal in the $AMP price started from the $0.010 support level and retested the overhead resistance at $0.015. However, the high selling pressure near the 50-period EMA resulted in a bullish failure leading to a falling channel pattern. Furthermore, the 50-period EMA provides constant dynamic resistance, and the bearish pattern accounts for a downfall of 22% in the last three weeks. 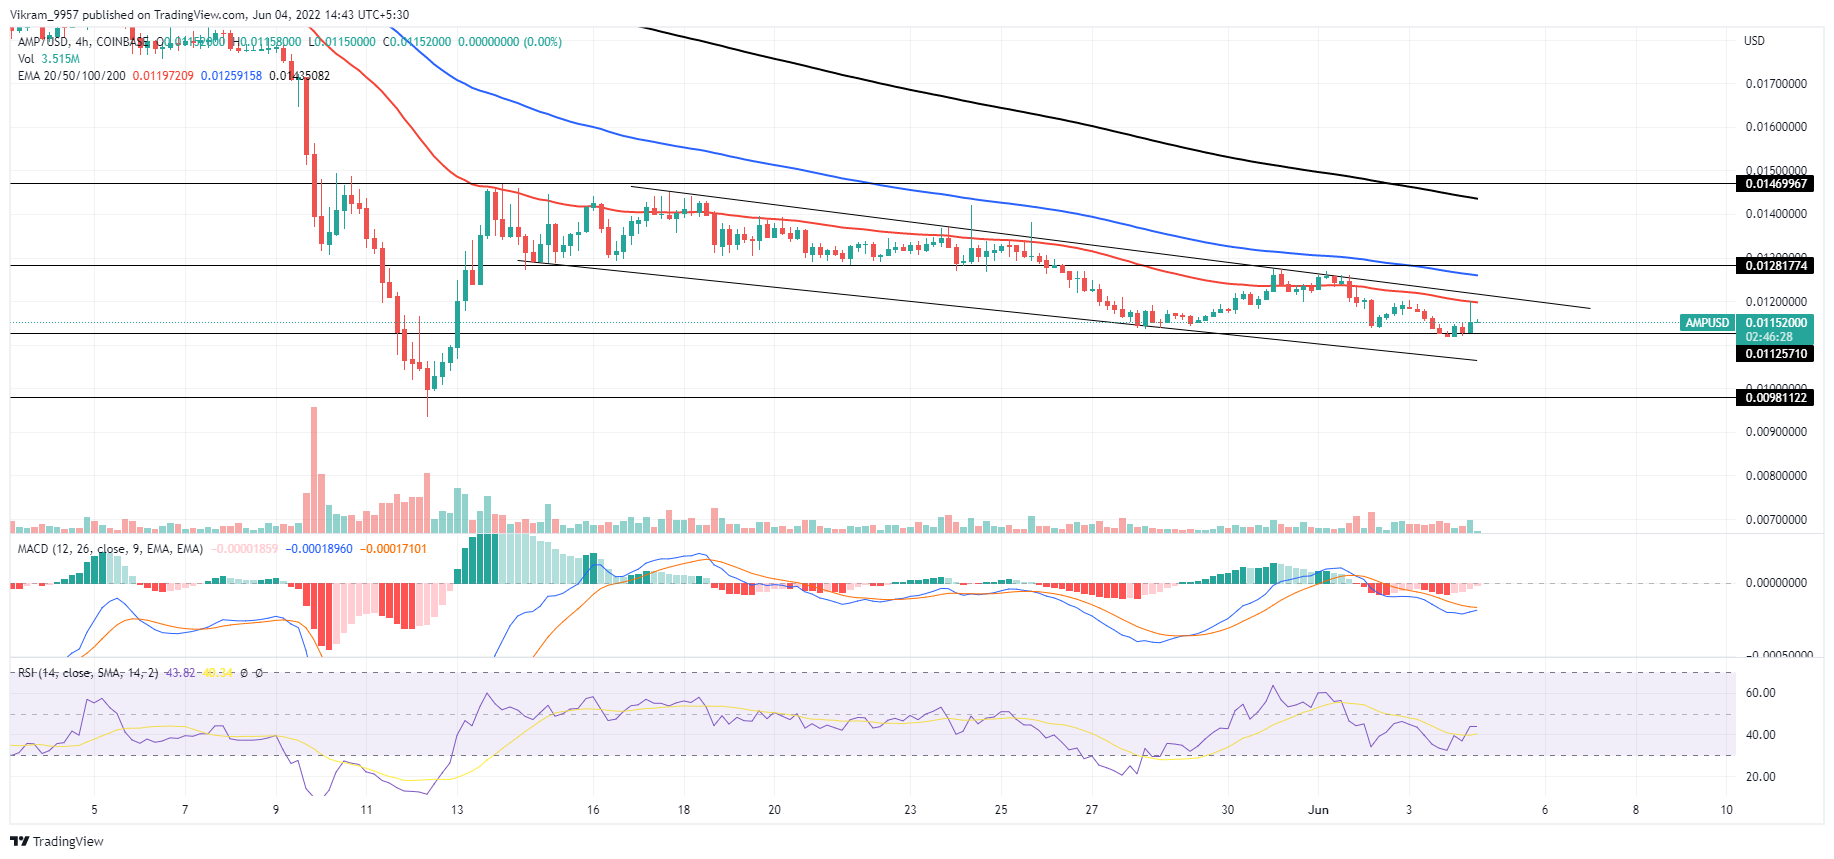 Source- Tradingview
$AMP Technical Analysis
The recent bear cycle in the falling channel takes support at the $0.011 support level and hints at a bullish reversal. However, the formidable sellers moving along the 50-period EMA oppose the bullish growth and warn against the support trendline fallout. The RSI slope in the 4-hour chart shows a bullish reversal after the divergence breakout surpasses the 14-day SMA and projects growth in underlying bullishness. Furthermore, the MACD and signal lines show a bullish reversal leading to a crossover event to reach above the zero line. Moreover, the falling trend in bearish MACD histograms adds points to the bullish crossover possibility. In a nutshell, $AMP technical analysis indicates a high possibility of the 50-day EMA if the trend sustains above $0.011.
Upcoming Trend
If the sellers manage to push down the $AMP prices under $0.011, a downfall to the next support level at $0.010 seems inevitable. However, a bullish reversal can lead to the 50-day EMA breakout resulting in a rally to $0.015. Resistance Levels: $0.012 and $0.015 Support Levels: $0.011 and $0.010