Theta Fuel is a POS (Proof-of-Stake) based blockchain network for video creation, delivery, and streaming. In other words, it is a decentralized, peer-reviewed video delivery platform powered by members. The Theta Mainnet 3.0 is set to be launched soon that will facilitate TFUEL staking and uptime mining. TFUEL is the gas token of this ecosystem and its technical analysis is as follows:
Past Performance
On May 29, 2021, TFUEL opened at $0.29. On Jun 4, 2021, TFUEL closed at $0.43. Thus, in the past week, the TFUEL price has increased by approximately 48%. In the last 24 hours, TFUEL has traded between $0.43-$0.45.
https://s3.tradingview.com/snapshots/3/35NTq8VZ.png
Day-Ahead and Tomorrow
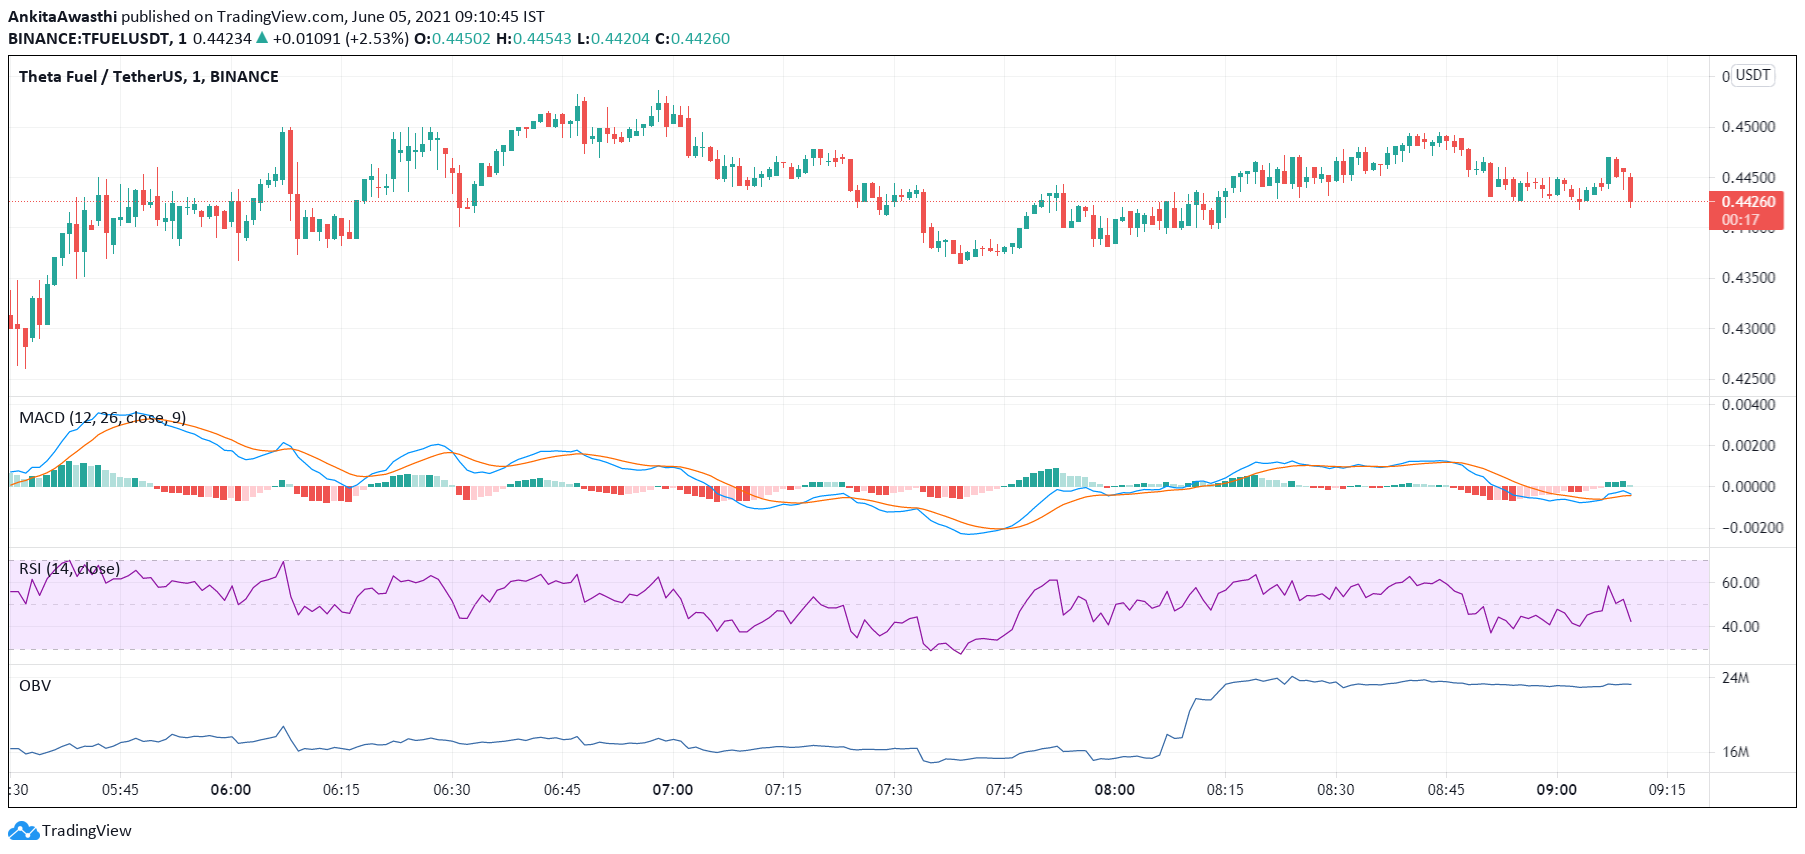
Currently, TFUEL is trading at $0.44. The price has increased slightly from the day’s opening price of $0.43. Thus, the market seems bullish.
The MACD and signal lines are negative. Thus, the overall market momentum has turned bearish. However, a bullish crossover by the MACD line over the signal line has occurred. Moreover, both the lines are closer to the zero line and may turn positive soon. Thus, a trend reversal may be on the anvil for TFUEL.
Currently, the RSI indicator is at 48%. It faced rejection at 51% and fell to the current level. Thus, selling pressures are high. The RSI oscillator is, thus, giving further credence to the negative momentum indicated by the MACD oscillator.
But, the OBV indicator is upward sloping. Thus, buying volumes are higher than selling volumes. High buying activity will exert upward pressure on the TFUEL price.
In short, when we look at all three oscillators together, we can say that the bearish trend may continue for some time. We have to wait and watch if the intermittent price rises are temporary or the beginning of a strong bullish trend.
TFUEL Technical Analysis
Currently, the price is below the second Fibonacci pivot resistance level of $0.45. The price may soon fall below the first resistance level of $0.44. Thereafter, we have to wait and watch if the price starts rising or continues to fall further.
The price has tested and fallen below the 23.6% FIB retracement level of $0.445. The price is soon likely to test and fall further below the 38.2% FIB retracement level of $0.442. If the price retests and breaks out of these levels in some time, then probably a price uptrend has set in. In that case, the price may continue to rise tomorrow as well.