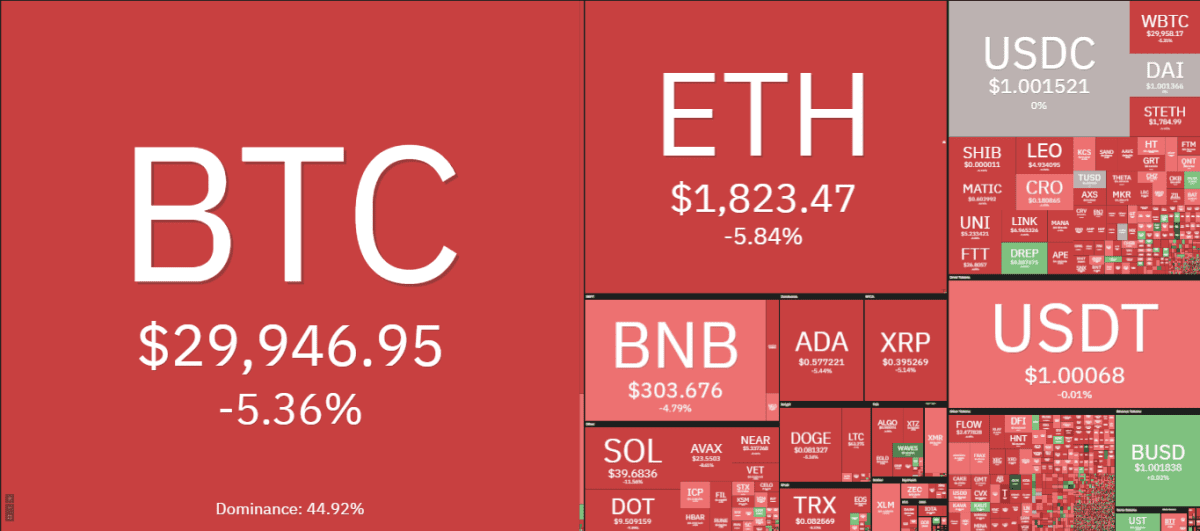
Litecoin price analysis is bearish as LTC/USD depreciates to the $62.82 mark after a bearish run. The bears have taken over the price charts once again and have pushed the prices below the $70 mark. The market is currently facing resistance at $69.03, and if the bears continue to exert their pressure, we could see Litecoin prices decline further to support levels of $62.39. The bulls had tried to enter the market but were unable to sustain the prices above the $70 mark, which resulted in a bearish pullback
The market had been on a slight uptrend in the past few days but has now reversed course and is heading towards the south. The market is currently facing resistance at $69.03, and if the bears continue to exert their pressure, we could see Litecoin prices decline further to support levels of $62.39. The bulls will need to make a strong comeback and push the prices above the $70 mark if they want to take control of the market again.
Litecoin price analysis on the 1-day price chart: LTC/USD is facing resistance at $69.03
On the 1-day price chart, we can see that Litecoin price analysis has formed a bearish candlestick pattern. Prices have been consolidating in a descending triangle pattern and currently, the market is testing the lower boundary of the triangle. If prices break below this level, we could see a further decline to support levels of $62.39.
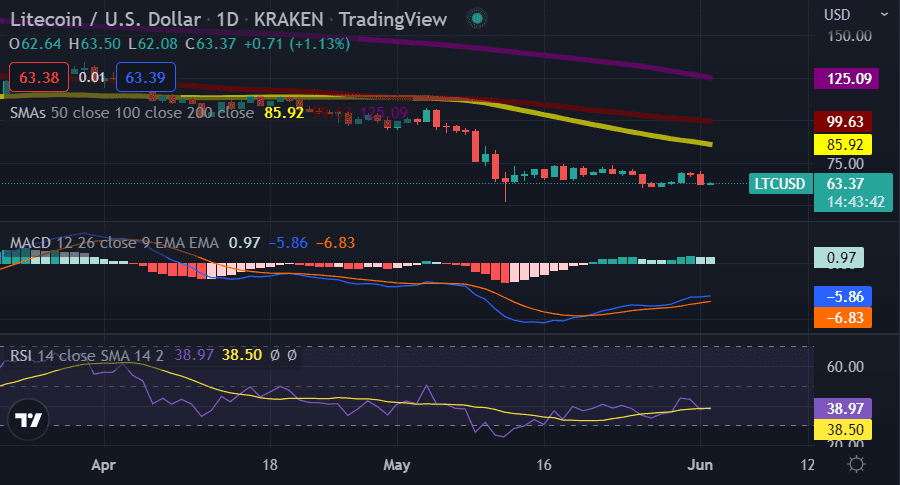
The RSI indicator is currently in the oversold region and is showing no signs of a bullish reversal. The MACD indicator is also bearish as the MACD line is below the signal line. The SMA50 (yellow line) is also below the SMA200 (blue line), which indicates that the market is in a bearish trend. On the 24-hour price chart, LTC prices are currently trading between the $69.03 and $62.39 marks.
Litecoin price action on the 4-hour price chart: Recent developments and further technical indications
The 4-hour price chart for Litecoin price analysis shows a continuous degradation of price, and no considerable bullish effort has been observed today. The last candlestick appearing on the 4-hour chart is a bearish one, with a long lower wick. This indicates that the bears are still in control despite some minor bullish pressure.
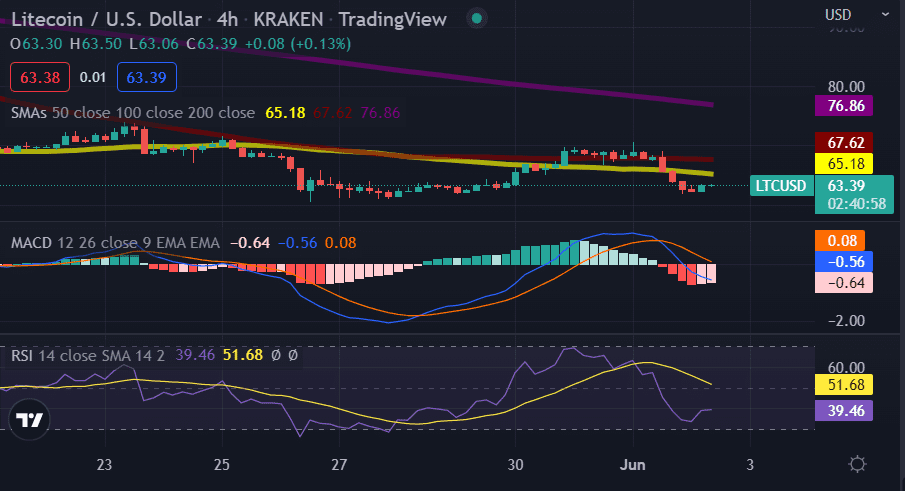
The technical indicator Relative Strength Index (RSI) is currently moving downwards and is approaching the oversold region. The Moving Average Convergence Divergence (MACD) line is below the signal line, which indicates that the market is bearish. The SMA50 (yellow line) is also below the SMA200 (blue line) is below the SMA50, which indicates that the market is in a bearish trend.
Litecoin price analysis conclusion
In conclusion, Litecoin’s price analysis shows that the market is currently in a bearish trend as prices are falling below key support and resistance levels. The technical indicators are also pointing to a bearish market trend. Therefore, traders should wait for a clear breakout above the $70 mark before entering any long positions. On the other hand, if prices break below the $62.39 support level, we could see Litecoin prices decline further to levels of $60.
Disclaimer. The information provided is not trading advice. Cryptopolitan.com holds no liability for any investments made based on the information provided on this page. We strongly recommend independent research and/or consultation with a qualified professional before making any investment decisions.