
- Now the bull’s efforts can be observed. The trend reversal has begun.
- The ENJ ecosystem is recovering. An uptrend can be observed across all short and long term graphs.
- The trading volume is at a gain of 91.95% in just 24 hrs.
Enjin coin is a project of Enjin, a company that provides an ecosystem of interconnected, blockchain based gaming products. The coin is unique in that every token minted with enjin platform, is directly backed by ENJ, giving in-game items real-world liquidity.
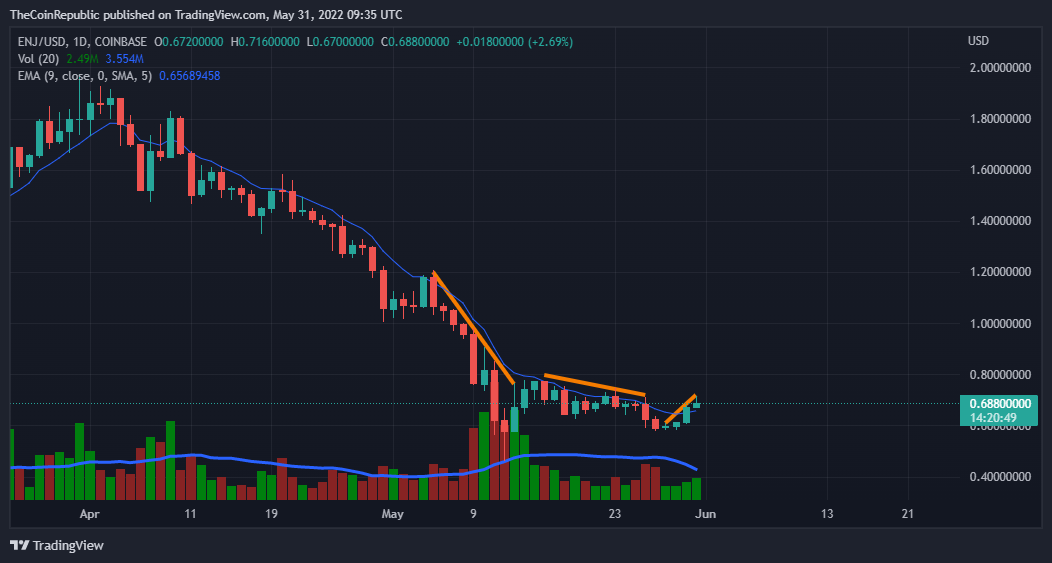
The coin was facing a downtrend over the daily graph since the end of march, but now the coin is making a green move following the traditional crypto currency Bitcoin. The BTC has been rising for the past 3 consecutive days. Now the bulls are participating, if the bullish movement continues the coin can recover soon, bears are definitely going to interrupt the process. So the coin needs to accumulate more and more buyers to make a successful green move over the graph. The price is moving above the exponential moving average.
The current price for one ENJ coin is $0.69 with a gain of 8.33% in its market capitalization in the last 24 hrs. The coin has a trading volume of 131 million with a massive gain of 91.95% in 24 hrs trading session and a market cap of 619 million which is at a gain of 8.33% in it. The volume market cap ratio for ENJ is 0.2111.
Short term Analysis
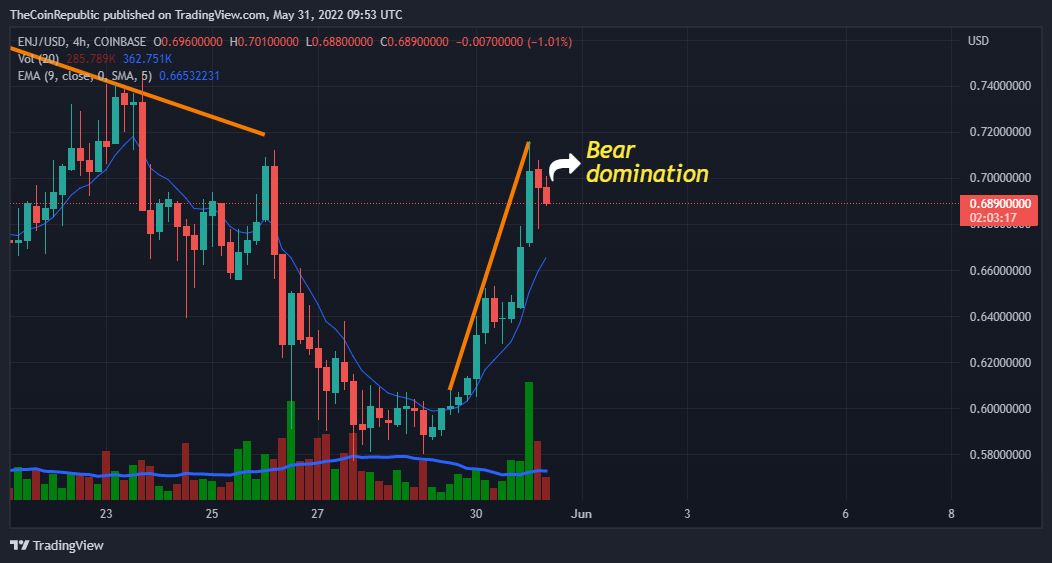
The short term (4 hrs) analysis shows a good uptrend movement in the ENJ price showing the bulls are taking a good interest in buying the dip. If the trend continues the ecosystem will recover soon. The price is moving above the moving average. But the bears will not sit putting hand on hand, they have started pushing the price and the effect can be seen over the hourly graph.
Technical indicators
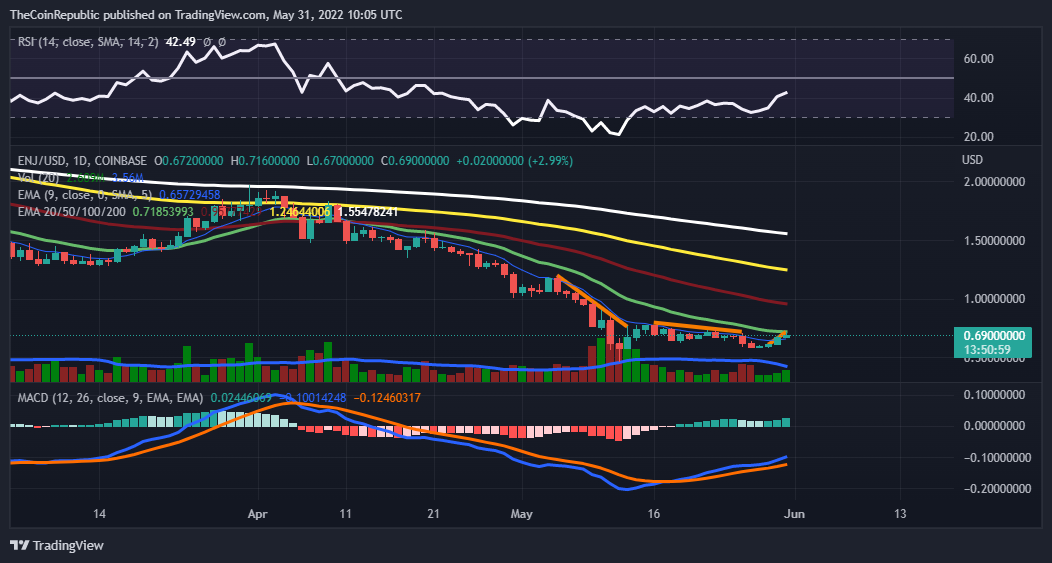
The MACD indicator is indicating a bullish movement further over the daily graph, the MACD line is moving above the MACD signal line. This time the signal intensity is looking strong as indicated by the histograms.
The relative strength index is also moving to the overbought region indicating the increase in buying. Looks like the bulls are really putting in some effort. The RSI value is above 40 currently.
Conclusion
The coin was facing a downtrend over the daily graph since the end of march, but now the coin is making a green move following the traditional crypto currency Bitcoin. The price is moving above the exponential moving average. Technical indicators are indicating a bullish rally ahead.
Technical levels
Resistance levels: $0.80 and $0.90
Support levels: $0.55 and 0.40.
Disclaimer
The views and opinions stated by the author, or any people named in this article, are for informational ideas only, and they do not establish the financial, investment, or other advice. Investing in or trading crypto assets comes with a risk of financial loss.