Fantom is an open-source blockchain platform that allows users to build innovative digital assets and decentralized apps. It is a fast, secure, and highly scalable network powered by smart contracts. FTM is the prime governance token of this ecosystem. FTM technical analysis is as follows:
Past Performance
On May 27, 2021, FTM opened at $0.38. On Jun 2, 2021, FTM closed at $0.35. Thus, in the past week, the FTM price has decreased by roughly 8%. In the last 24 hours, FTM has traded between $0.34-$0.35.
https://s3.tradingview.com/snapshots/k/kaRjWWSQ.png
Day-Ahead and Tomorrow
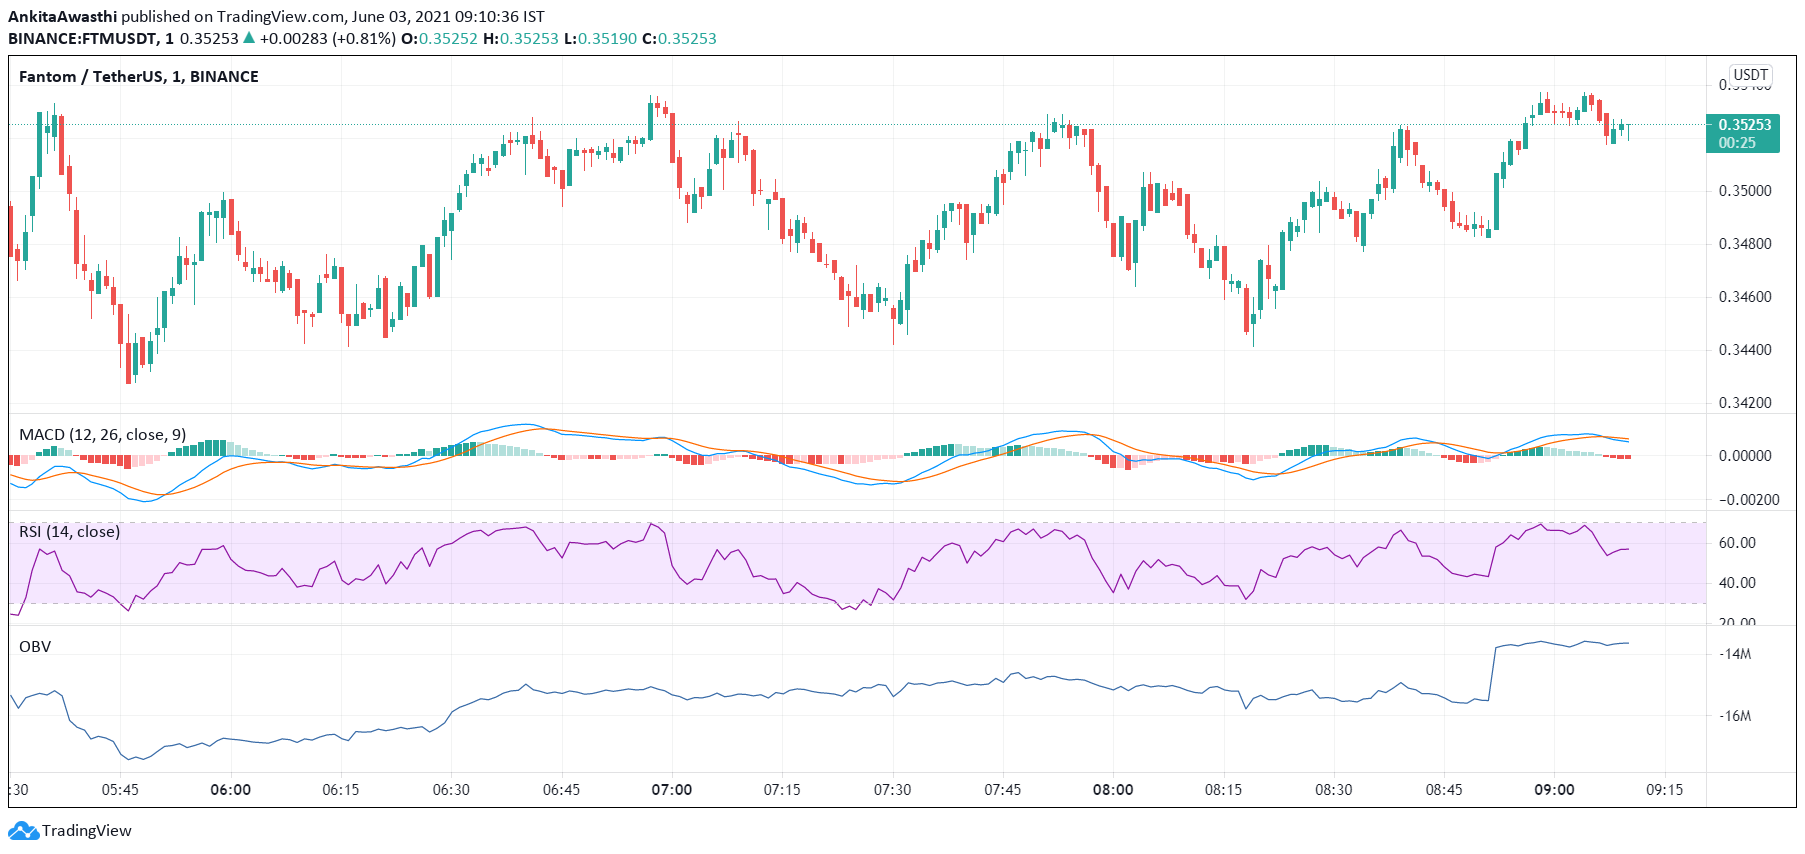
Currently, FTM is trading at $0.35. The price has remained unchanged from the day’s opening price of $0.35. Thus, the market sentiment is neutral with equal buying and selling pressures.
The MACD and signal lines are positive. Thus, the overall market momentum is bullish. However, a bearish crossover by the MACD line over the signal line has occurred. Plus, both the lines are closer to the zero line and may turn negative soon. Thus, we can expect a price pullback.
Currently, the RSI indicator is at 51%. It faced rejection at 48% and rose to this level. Thus, buying pressures are gradually mounting. Hence, the FTM price may start rising after falling for some time.
Besides, the OBV indicator is upward sloping. Thus, buying volumes are higher than selling volumes. High buying activity will exert upward pressure on the FTM price. There is bullish divergence here.
In a nutshell, when we look at all three oscillators together, we can say that a price uptrend is likely to set in. However, intermittent price pullbacks amidst a bullish trend cannot be ruled out.
FTM Technical Analysis
Currently, the price is above the second Fibonacci pivot resistance level of $0.353. The price may soon fall below the first Fibonacci pivot resistance level of $0.346. Thereafter, we have to wait and watch if the price starts rising.
Presently, the price is above the 23.6% FIB retracement level of $0.35. The price is likely to soon test and fall below it and further below the 38.2% FIB retracement level of $0.346. By day end, if the price retests and breaks out of these levels, then probably the bullish trend is strong and may sustain till tomorrow as well.