- The Solana is approaching the lower vege of Bollinger Bands indicator in terms of the daily price chart.
- During the downtrend, SOL speculators noted a nearly 98% drop in trading volume over the last night.
- The SOL/BTC pair price is in the red zone by 8% with the presence of 0.001427 Satoshis.
The Solana coin started a downside correction after reversing the short-term resistance level of $60, which is still valid as an important bullish barrier. Thus, the bulls are battling the selling pressure and waiting for the right time.
The price of SOL has dropped more than 13% to roughly $41.60, its lowest level in two weeks. The SOL/USD pair, in particular, came out of a concealed technical pattern in what looks to be a bearish flag, the occurrences of which are frequently accompanied by more market negative swings.
As with the daily price chart, Solana is approaching the lower edge of the Bollinger Bands indicator, meanwhile the semi-line (20-day moving average) of the BB indicator is appearing as a bear sell zone. Thus a durable upward movement occurs when price breaks this horizontal zone at higher volumes.
Solana holders have lost over 21% of costs so far, so the bulls are waiting for a bullish opportunity. At the time of writing, Solana Coin is trading near the $40 round level at the $41.3 mark, which could act as a short-term support.
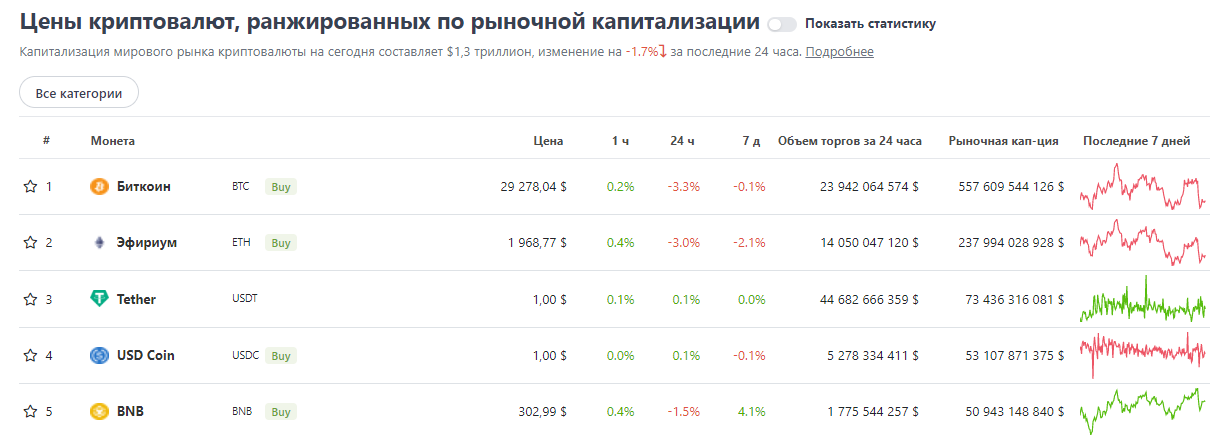
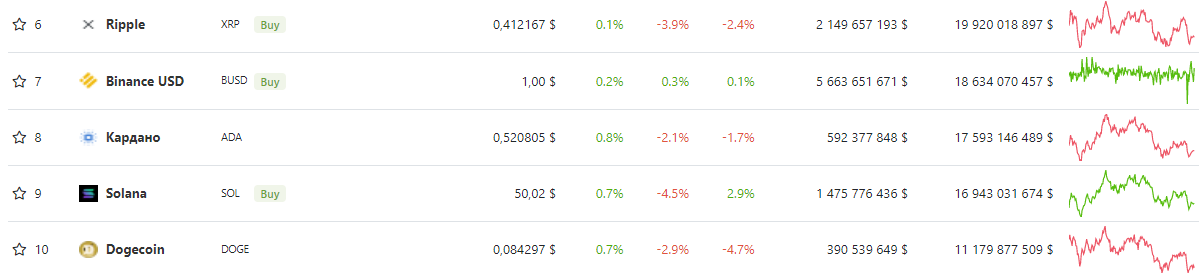
According to CMC, SOL’s market cap fell 7.2% to $13.9 billion in the past 24 hours. Moreover, the SOL/BTC pair price is in the 8% Red Zone with the presence of 0.001427 satoshis.
Solana again headed towards 52-weeks low
Trading volume climbed nearly 80% over the previous night but this is not enough to reverse the ongoing trend.
On the downside, the daily RSI is moving into oversold territory after a consolidation phase.
Сonclusion
Solana investors may attempt a reversal trend near the $40 mark. But the price accumulation appears to be weak, therefore, there is not enough trading volume to reverse the ongoing trend.
Support level – $40 and $30
Resistance level – $60 and $100
Disclaimer
The views and opinions stated by the author, or any people named in this article, are for informational ideas only, and they do not establish financial, investment, or other advice. Investing in or trading crypto assets comes with a risk of financial loss.