Aave price analysis is showing AAVE prices are stuck in a strong bearish trend as it tumbles down to $95.36. The coin has seen a continuous decline since yesterday. However, Aave’s price found some support at $91.48 yesterday, but it was not enough to stop the selling pressure. Resistance for the coin lies at $105.34. The overall coin value has been damaged by this, as recovery prospects have been delayed. It is anticipated that further depreciation will follow in the next hours.
The bears are currently in control of the market, and a further price drop is expected in the next 24 hours. The cryptocurrency has a market trading volume which is at $386,811,049 with a market capitalization of $1,322,541,472. The digital asset is ranked in the 28th position in the market.
AAVE/USD 1-day price chart: AAVE prices fail to breakout
On the 1-day Aave price analysis chart, we can see Aave prices have fallen sharply since yesterday. The market opened today at $103.55 and has been in a downward spiral ever since, currently trading at $95.36. The previous support at $91.48 proved to be not strong enough as the bears pushed the prices down further. The immediate resistance lies at $105.34, and if the bulls can manage to push the price up above this level, we might see some relief in the market. However, given the current market conditions, it is unlikely that the bulls will be able to stage a significant comeback in the near future.
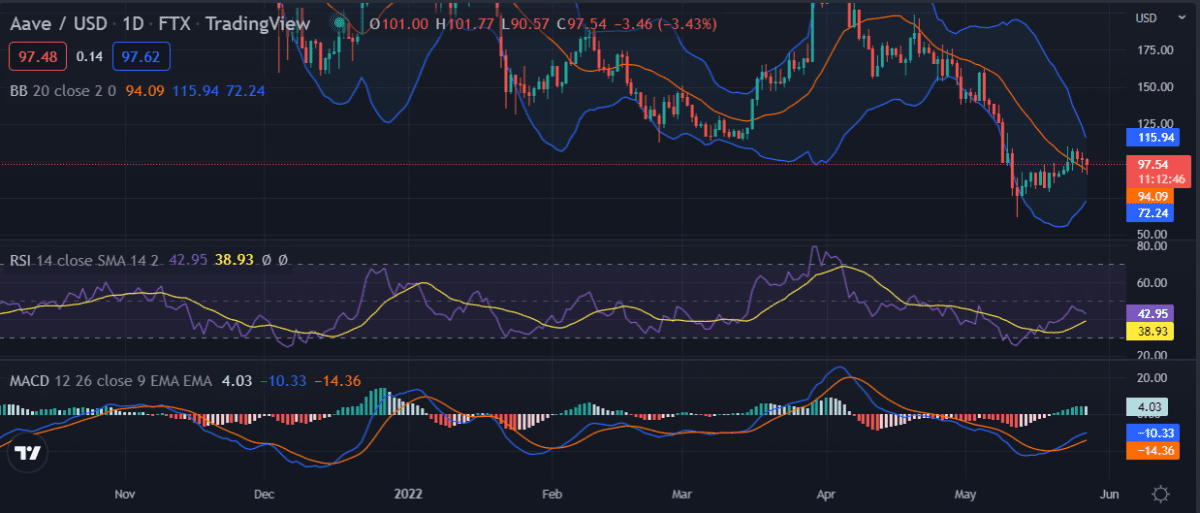
The Bollinger bands are showing that the market is highly volatile as the price action is fluctuating between the upper and lower band. The moving average convergence divergence indicates that the market is in a bearish trend as the MACD line has crossed below the signal line. The relative strength index is also in favor of the bears as it lies well below 50, indicating that the market is currently in a bearish grip.
Aave price analysis on a 4-hour price chart: AAVE to test the $95.36 level
Aave price analysis shows AAVE prices are currently trading at $95.36 after a significant loss in value over the past day. The market is volatile, with bears and bulls fighting for control, leading to large swings in price. So far, the bears have been more successful as they push the price lower. This downward trend is expected to continue until a clear reversal sign is shown soon enough unless changes occur before some time passes, which seems unlikely given current circumstances.
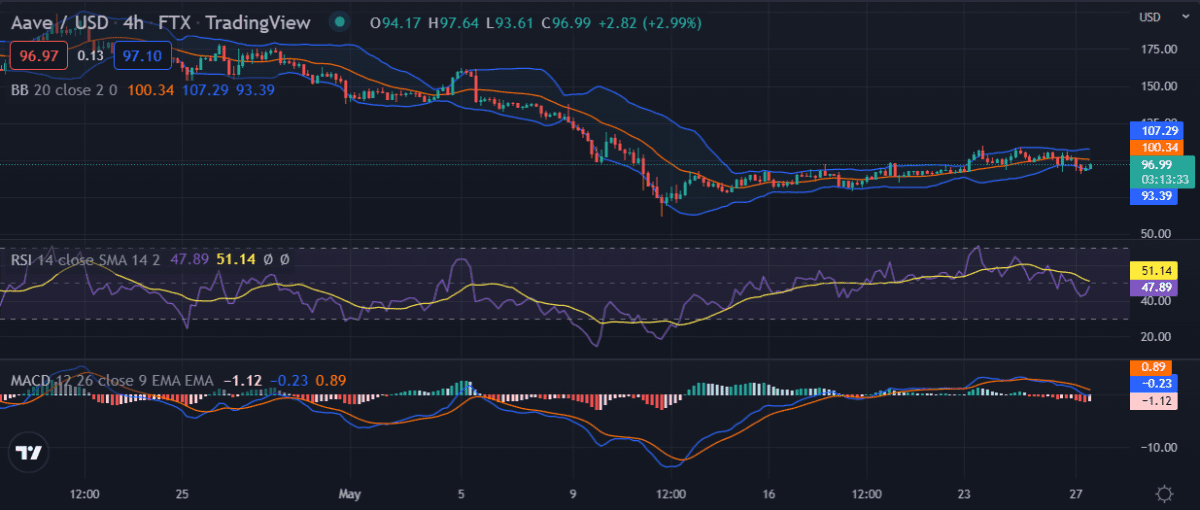
The MACD line blue has crossed below the signal line red, indicating that the market is in a bearish trend. The relative strength index is hovering just above the 40 levels, showing that the market is neither oversold nor overbought at this time. The Bollinger bands are stretching outwards on the 4-hour chart which indicates that the market is highly volatile and a change in prices is likely to occur due to the current market dynamics.
Aave Price Analysis: Conclusion
Aave price analysis shows that the market is currently in a bearish trend as prices continue to slide down. The market is highly volatile, with large swings in price. The immediate resistance lies at $105.34, and if the bulls can manage to push the price up above this level, we might see some relief in the market. investors are advised to remain cautious as the market is highly unpredictable at this time.
Disclaimer. The information provided is not trading advice. Cryptopolitan.com holds no liability for any investments made based on the information provided on this page. We strongly recommend independent research and/or consultation with a qualified professional before making any investment decisions.