Seasonal effects are common in financial data sets. The prices of commodities change because of the shifts in temperature between the summer and winter months. The prices of stocks are affected by the annual earnings season and the Christmas holiday period.
The digital asset class is no different. While it’s true that there is only 10 years of data to draw from, even so, if someone asks ‘what are the best months for crypto’ there are a range of observations that can be made around what Bitcoin and the rest of the crypto markets are more likely to do during particular months or quarters of the year.
For example, digital assets still react to impending tax seasons and holidays like Chinese New Year. As we enter summer 2022, following a difficult beginning to the year, Brave New Coin explores the historical price performance of Bitcoin and Ethereum in June to see if any emerging patterns can add information to crypto trading and investment strategies.
Bitcoin in June
In terms of the best months for crypto gains, June has historically been a middling month for Bitcoin. Over the last 11 years, on average, the price of BTC has risen by a steady ~10.1% during the month. The extended summer months, between May and October, have generally been a period of seasonal weakness. In trading, there is a saying “sell in May and go away”, it is based on stocks’ historical underperformance during this 6-month period. Overall, the best months for crypto historically, and for Bitcoin in particular, have been November and April.
There are a number of theories for why this pattern recurs. In the early days of modern financial markets in the 20th century, there was a direct tie to the agricultural production cycle. Today, the mid-April US income tax filing deadline is considered to be a more direct factor.
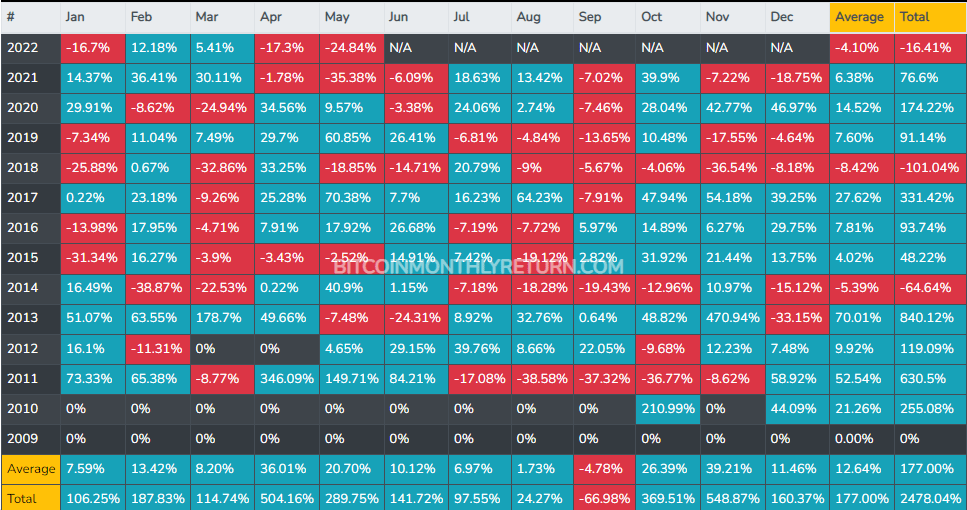
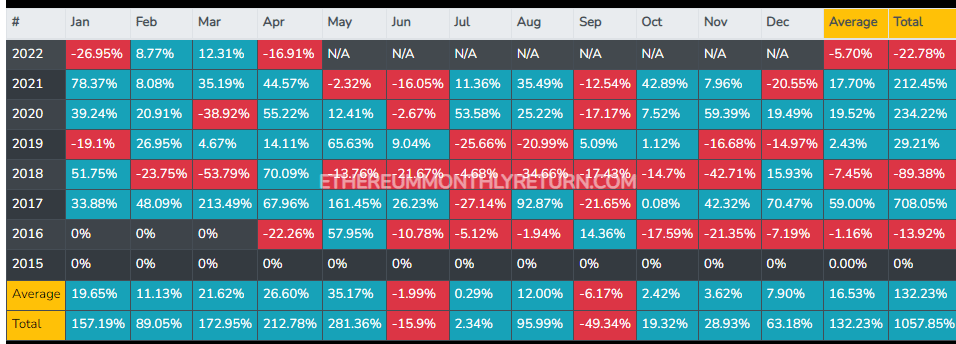
Bitcoin Monthly Returns
The average monthly return of Bitcoin between the beginning of May and the end of September since 2011 is ~6.95%. The average monthly return in the other seven months of the year is ~20.33%. In bearish years like 2018, BTC primarily traded red through these months.
2022 has so far been a poor year for BTC with this April being the worst April month ever for the asset. Now, three weeks into May 2022, Bitcoin is already down ~29%. May 2022 looks set to be the worst May ever for the asset.
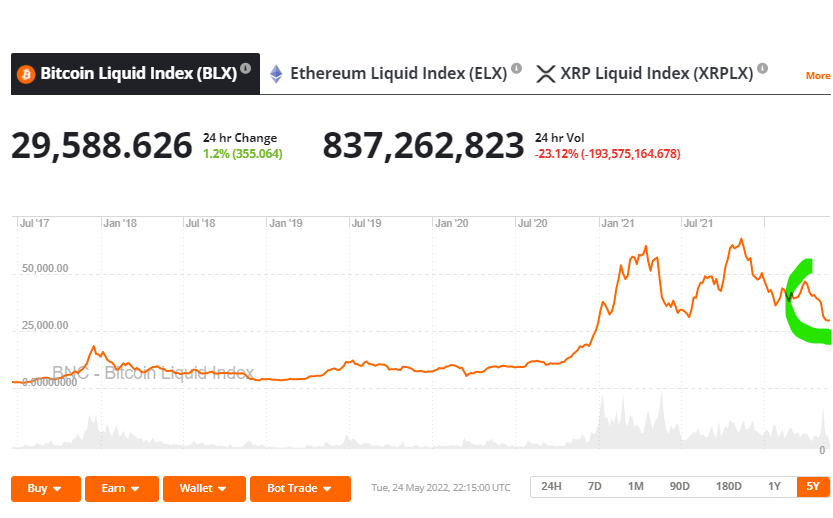
The price of BTC is down ~37.9% year-to-date. The draw-down since Bitcoin reached its last all-time high currently stands at ~57.8%. The all-time high price of the asset of ~US$69,050 was hit on Nov 10, 2021, just over six months ago. The asset currently trades for US$29,774.29.
While a 57.8% drawdown may turn participants from legacy financial markets as white as a sheet, large drawdowns of over 50% happen often in crypto markets in general - and regularly for Bitcoin.
Between June 2011 and November 2011, for example, the price of BTC dropped ~93%, falling from trading at ~US$32, to ~US$2 in under six months. Between November 2013 and January 2015, the price of BTC dropped ~88%. The asset went from trading for US$1,242 to trading for ~US$152 in just over a year. Between December 2017 and December 2018, the price of BTC dropped ~84%. From trading for ~US$19,900, over the course of a year, the asset dropped to trading for ~US$3,129. Between six chaotic days in April 2013, the price of BTC dropped 81%. From trading for US$266, the price of BTC dropped to US$50.
The current drawdown currently ranks as Bitcoin’s 5th steepest decline ever. It is not yet clear whether the price of BTC has bottomed. There may still be more bearish price action to come before we can determine exactly where the current price drop will stand amongst BTC’s other price collapses.
Bitcoin has so far recovered from its large drawdowns and in each of the mentioned price declines, BTC bulls have reclaimed the price they fell from. However, the time for each recovery was at least three times as long as the drawdown. The recovery to reclaim the original price from the two longer drawdowns mentioned, 2013 to 2015 and 2017 to 2018, took almost three years.
# The short term macroeconomic picture
There are concerns that the ongoing drawdown may continue because of the bearish macroeconomic headwinds creating fear and uncertainty for investors across all financial markets.
Market momentum for speculative assets like equities and crypto has fallen away amid concerns that global inflation will continue to surge and economic growth will slow. Inflation in the USA, the world’s largest economy, hit a four-decade high of 8.5% in March 2022. In April 2022, this number marginally dropped to 8.3%. Still, a high number is well above the targeted inflation rate of 2%. In the Eurozone, inflation hit 7.5% in March.
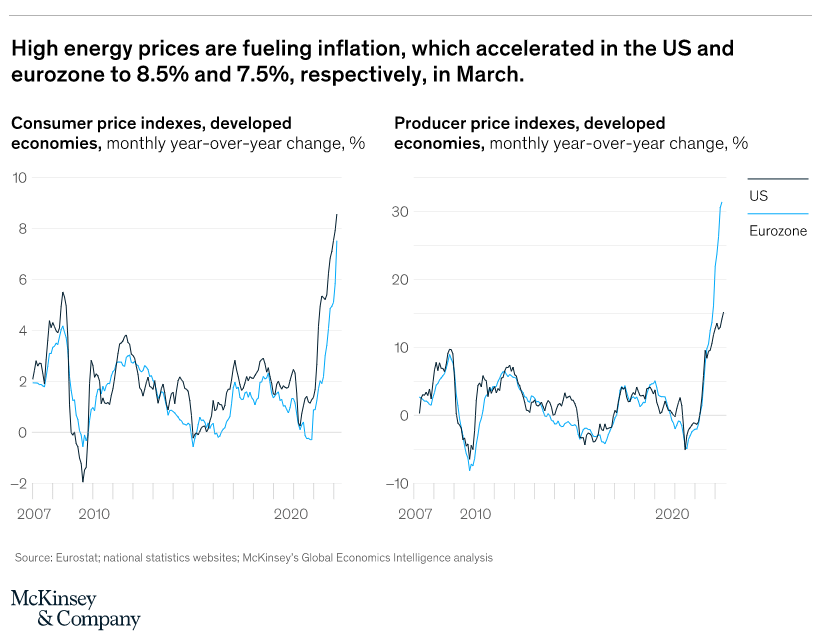
Source: Mckinsey Global Economics Intelligence executive summary, April 2022
These economies now face the possibility of stagflation, a situation where the inflation rate is high but economic growth is slow. Policymakers face a difficult challenge, sharp interest rate rises will reduce inflation but will negatively affect already stagnant growth and unemployment. Trying to gradually raise interest without affecting economic growth may be too conservative and could lead to inflation surging even higher.
In May, the US Federal Reserve raised interest rates by 0.5% in response. Most forecasts predict more aggressive rate hikes are set to be introduced as the economy tangles with historically high inflation.
In recent days US central bankers have broadly backed two more large interest rate rises in June and July. There is a mix of optimism and skepticism about how the inflation situation will play out after this. The more bearish view is that geopolitical hurdles like the Russia-Ukraine conflict and China’s COVID-19 lockdown may intensify inflation.
While some central bankers remain optimistic, the market appears to be bearish. Inflation expectations in the United States, as of April 2022, are the highest they have been in recent years, as reflected by the spread between 5-10 year yields on Treasury bills vs inflation-protected securities.
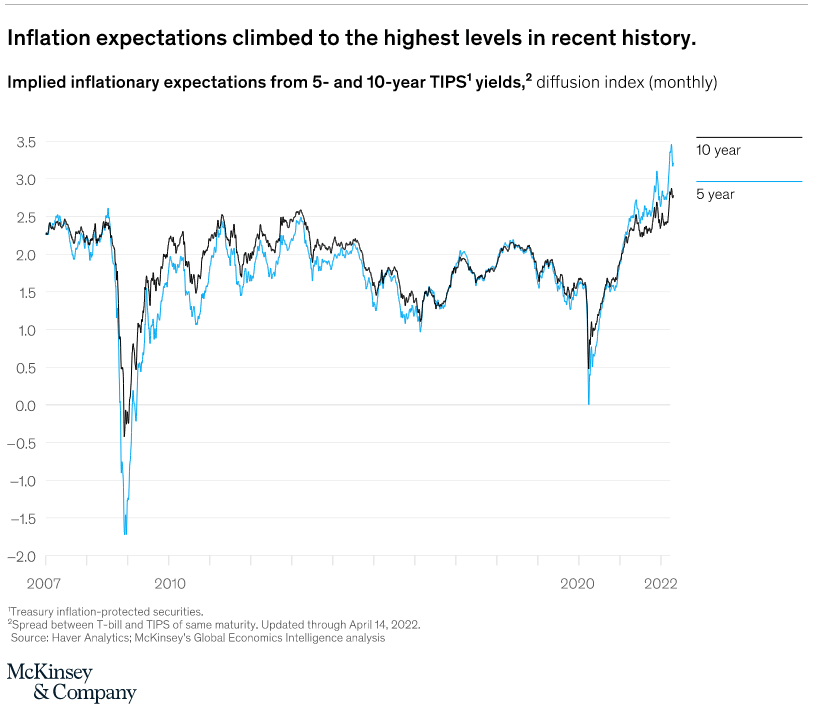
Source: Mckinsey Global Economics Intelligence executive summary, April 2022
Investors appear to have lost confidence in the ability of Central Banks globally to dig economies out of the stagflation and recession hole.
They are pulling money away from risk markets and into safe, stable investments. Most investors expect markets will remain volatile and skewed towards the downside.
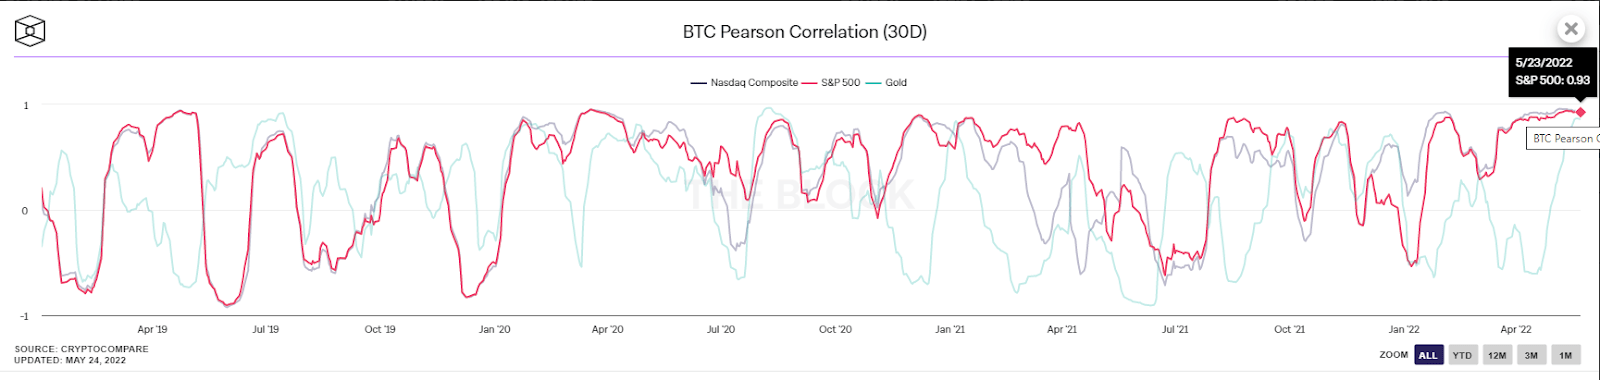
Bitcoin has been mooted as an uncorrelated asset in the past, an asset unaffected by business cycles. It has an independent monetary policy unaffected by politics and does not produce cash flows. It shouldn’t be affected by a recession the same way equity markets are.
Correlation data, however, indicates that the relationship between Bitcoin price and major stock indices like the S&P500 and Nasdaq composite is as strong as it has ever been. The 30-day rolling Pearson correlation coefficient between the Bitcoin price and the Nasdaq composite currently sits at 0.95, between the S&P500 it currently stands at 0.93. Bitcoin has in the past behaved like an uncorrelated asset, presently it is not and is behaving like a speculative risk asset.
Both crypto and stocks have fallen in recent months as a result of the bearish global macro situation. Fear in crypto markets has been exasperated by the collapse of the Terra-Luna project, which led to billions of dollars of value evaporating from the digital asset marketplace in a matter of weeks.
During periods of recession, the prices of stocks often plummet. Markets are often volatile and price swings are frequent. Investors react sharply to news events - ones that offer hope and the ones that are bleak, but there is a general view that there is a downside skew to this volatility and jitteriness. This uncertainty creates a flight to safety mentality for some investors and they often pull their capital from the stock market entirely.
During recessions, consumer spending drops and unemployment rises, this affects the earnings of publicly listed companies like Tesla and Netflix. While we are not in a recession the earnings of major tech companies already appear to be flagging. Social media firm Snap, which is behind the popular app Snapchat, fell by ~43% on Tuesday following a warning on Monday that it would likely miss quarterly estimates as the economy has “deteriorated further and faster than anticipated.” This warning spread fear across the rest of the stock market and led to even more sell-offs.
Cryptographic networks like Bitcoin and Ethereum are used by everyday consumers. If their wealth and ability to spend are affected by a recession, these cryptographic networks see drops in activity and value.
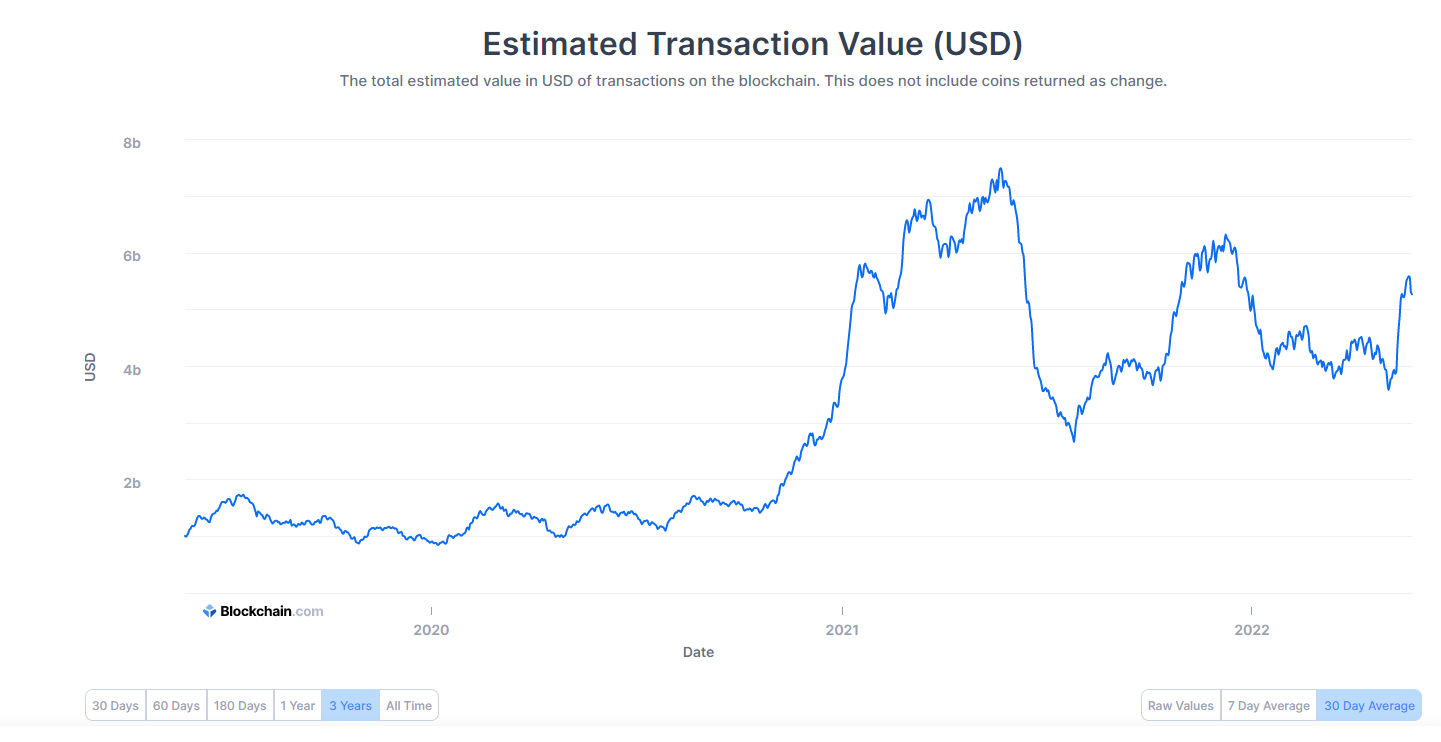
Estimate Bitcoin transaction value, last 3 years Source: Blockchain.com
As expected, the BTC price and the daily estimated transaction value (30 days) have moved together closely for most of the last three years. A flywheel type effect where one affects the other can be observed — Price rises create interest to use the network, likewise, more interest to use the network boosts the price as value is injected into it — vice versa, when price is dropping.
In 2022, however, the price of BTC has dropped sharply while the onchain transaction value has been steady and enjoyed isolated pickup periods.
This suggests the current BTC price drop is driven by bearish speculation and not a fall in network activity. This may imply traders are front-running network users and are selling their BTC in anticipation of a recession and a potential fall in Bitcoin prices.
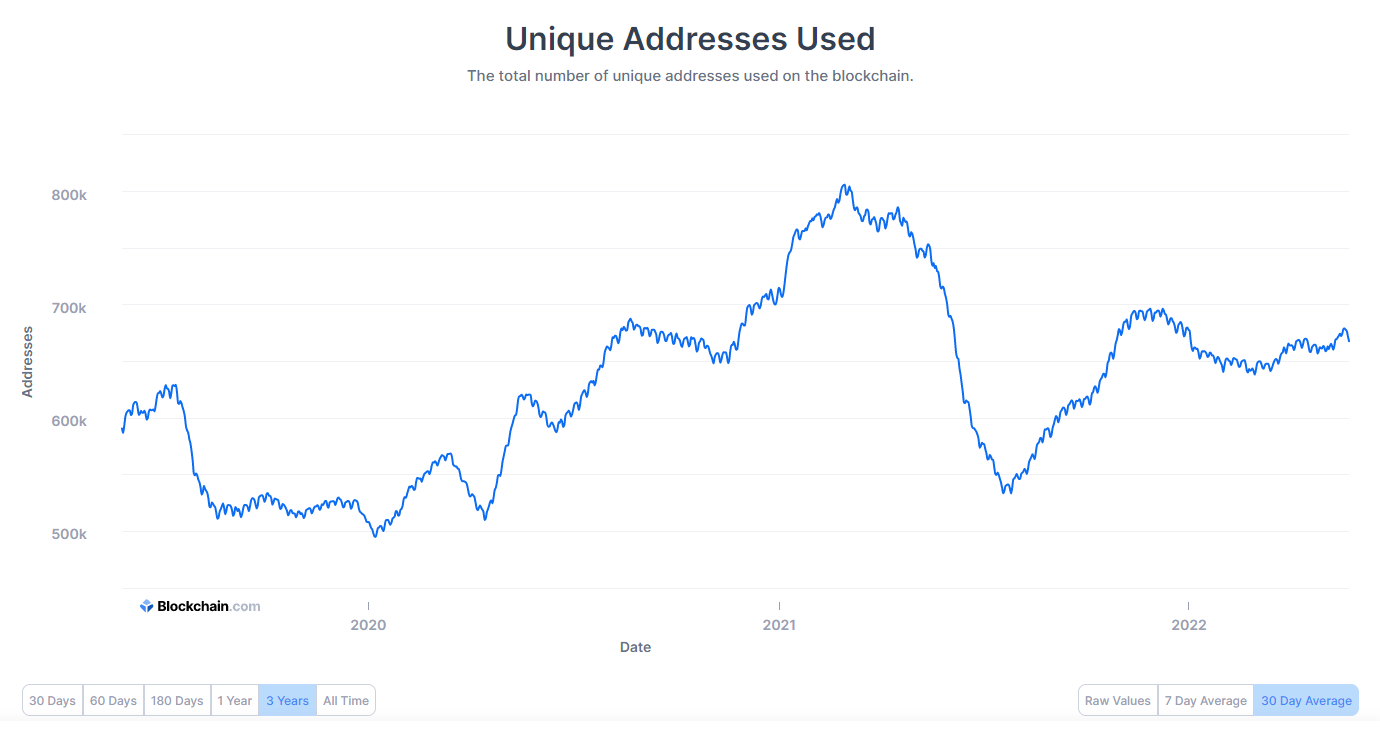
We see a similar pattern with unique address activity, it has remained steady despite the fall in the price of BTC.
Ethereum price performance in June
“Sell in May and stay away,” needs to be slightly modified for Ethereum. For the digital asset market's second largest asset, “Sell in June and be back soon” is a more apt strategy. May has historically been Ethereum’s strongest month for average monthly returns, however, the asset still has a period of summer weakness with June and September being the asset’s two weakest months.
In June, the historical average return of Ether is -1.99%. In the months between June and October, the average monthly return is 1.31%. The average monthly return for the other seven months of the year is 17.96%.
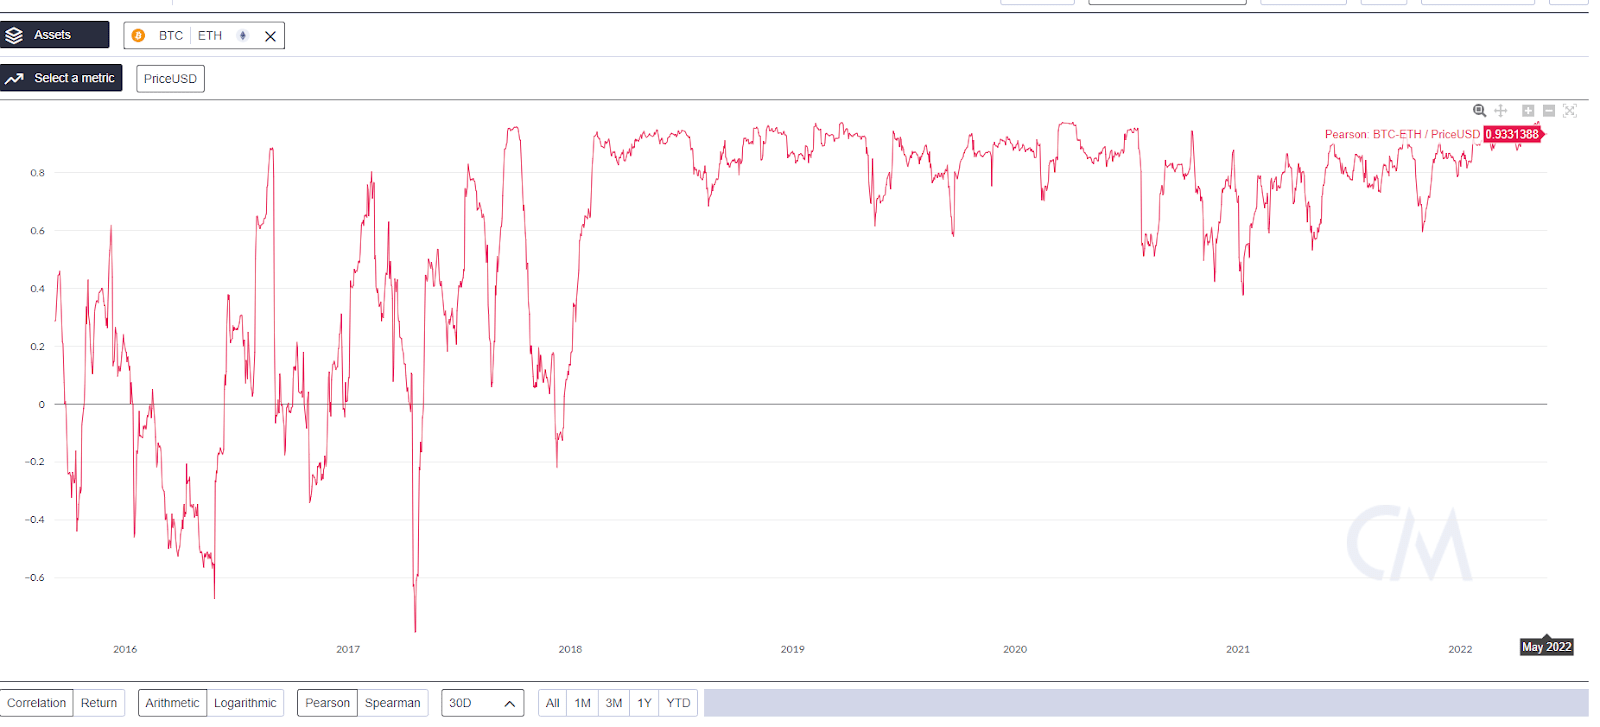
May 2022, however, has been a difficult month for Ether. So far the asset is down ~29.15% through the first 25 days of the month. ETH, alongside the rest of the crypto market, has suffered because of the bearish macro environment and a cool down following a strong finish to 2021. The 30-day Pearson correlation coefficient between BTC and ETH prices currently sits at 0.93. Markets, both crypto and equities, are moving in step together, showing a high sensitivity to news events.
This summer might be different for Ethereum, with a major fundamental update to the network set to create positive momentum for the Ether token.
Ethereum 2.0, also referred to as ETH2 or Serenity, is an updated version of the existing Ethereum blockchain that is designed to address the network’s limitations while still maintaining its integrity as a decentralized blockchain. The core infrastructure changes set to be implemented in ETH 2.0 are a switch from a proof-of-work (PoW) consensus model to a proof-of-stake (PoS) system and the introduction of sharding. This process horizontally partitions a database into parallel channels that work synchronously. Following the switch, Ethereum will become faster, cheaper, and more environmentally friendly.
The next major step will see the current Ethereum mainnet merge with the central beacon chain, which coordinates all shards in the future, becoming its own shard that uses proof-of-stake instead of proof-of-work. The merge will mean current Ethereum smart contracts will run on PoS instead of PoW, while maintaining the full history and current state of the Ethereum network.
Ethereum core developer Preston Van Loon told a panel at the Permissionless Conference earlier this month that there is momentum driving the launch of the Ethereum merge within the next three months.
Parallel to Loon’s comments, Ethereum researcher Drake Justin said there is a “strong desire to make this happen before difficulty bomb in August” and the “stars are aligned for the update.”
The difficulty bomb is a mechanism built into the network that intentionally slows down the network at a predetermined point. It is designed to encourage the transition from Proof-of-Stake to Proof-of-Work and push developers to work on the switch. The bomb can be delayed but many developers don’t want this option to be taken.
The Ropsten public testnet is set to undergo the merge on June 8th. The Ropsten testnet was developed by the Ethereum Foundation and is considered one of the best versions of the mainnet available.
Phase 0 in December 2020 invited Ethereum users and holders to deposit their ETH into a staking contract that would eventually be the basis for Ethereum’s staking rewards model. The contract eventually launched when a sufficient amount of ETH was deposited into the contract to meet a predetermined decentralization threshold.
The contract was immediately popular and existing Ethereum network participants were happy to lock assets into it, despite knowing that they would not be able to touch these until PoS went live as part of the merge.
It has been about a year and a half since the launch of Phase 0 and the ETH2.0 staking contract. The Ether committed remains vaulted away. The willingness of users to lock ETH away was a sign of the commitment and long-term belief the Ethereum community has for the network.
In February 2021, on the back of the Phase 0 launch of ETH2.0 and a strong January 2021, Ethereum hit a new all-time high above US$1500.
The summer is a historically tepid period for Ether and this pattern may continue given the macro tailwinds dragging markets, and Ether’s close relationship with the Bitcoin price and stock markets. ETH bulls, however, will likely be encouraged by the ongoing progress of the Ethereum 2.0 merge. If everything continues to progress as expected and the merge does occur in August, some fundamentally driven price momentum may be generated over the next couple of months.
Conclusion
If you’re looking for the best month for crypto, it isn’t June, as it is an historically middling month for digital assets, particularly for Ether and altcoins. Heading into June 2022, markets appear beleaguered and coming down from an exceptionally bullish 2021.
2022 has been a difficult year so far for crypto. Some of this bearishness may be prescribed to profit-taking and seasonality, but there are negative macro headwinds dragging all markets, and perhaps until these clear, the crypto market is not likely to create the bullish momentum that drove 2021’s positive price movements.
If some of the macro fog does clear, however, network fundamentals for both Bitcoin and Ethereum appear stronger than price. Summer may normally be a difficult time for crypto but in the short to medium term, price and fundamentals should realign and this will create positive price momentum.