Neo price analysis shows that Neo prices are currently in a bullish trend as the price goes above $10.56. The support is present at $10.15, and the price is facing resistance at $10.58. A breakout above this resistance can take the prices to $11.23.levels.NEO/USD price is currently enjoying a good run, as it has been one of the best-performing, which is a good sign for traders who believe in the potential of this digital asset.

The digital asset is currently trading at $10.56, and it has gained 8.96 percent in the last 24 hours. The market capitalization of the digital asset is $ 744,756,776 and the 24-hour trading volume is $55,723,060. Neo price analysis shows that the digital asset has been on a tear, as it has gained nearly 30 percent in the last 7 days, which is a bullish sign. The breakout has occurred with good volume, which is another bullish sign.
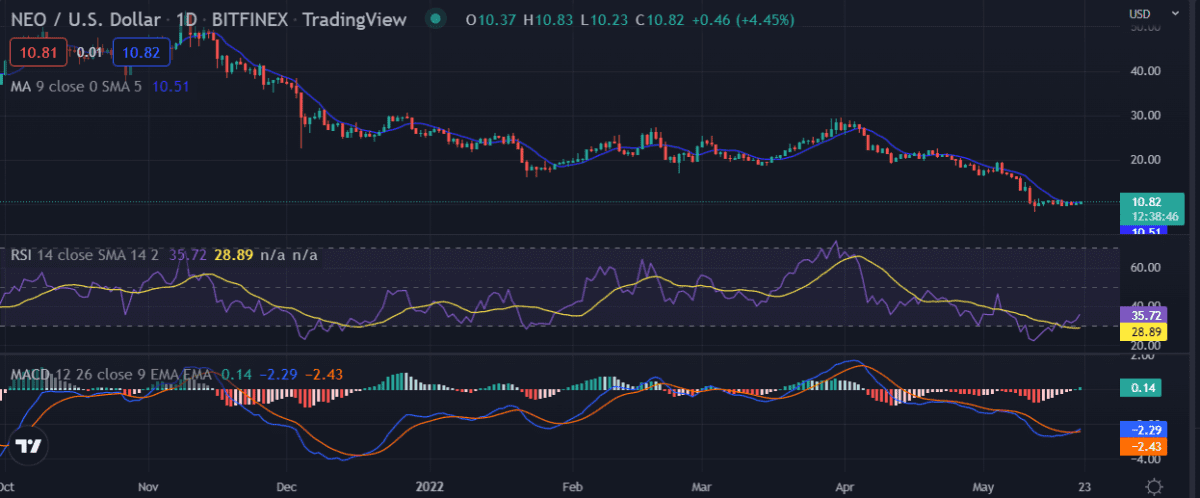
NEO/USD 1-day price chart: Price levels up to $10.56, bulls manage to penetrate
Neo price analysis one-day price chart bulls are trying to overcome the bearish pressure and have succeeded so far in their struggle as the prices increased today. The past week has been mostly bearish for NEO as it corrected lower from highs around $ 11.23 levels to lows around $9.64 levels. However, the bulls have managed to make a comeback and push the prices higher. The support is present at $10.15 levels, and the resistance is present at $10.58 levels. The digital asset is currently trading near the resistance level and a breakout above this level can.

The MACD shows that the bulls are losing momentum as the MACD line (blue) is close to crossing below the signal line. The RSI is currently at 54 levels, which shows that the digital asset is neither overbought nor oversold levels, while MA’s are bearing crossover formation.
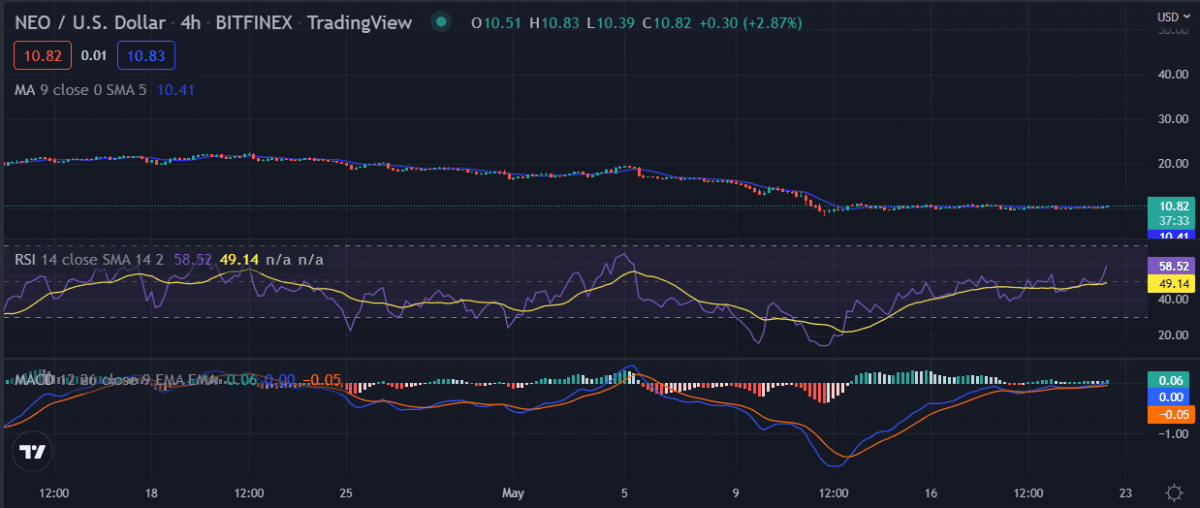
NEO/USD 4-hour price chart: Recent developments and further technical indications
4-hour Neo price analysis shows that the prices have corrected lower after making highs around $10.56 levels, as the bulls take a breather. The digital asset is currently trading at $10.42 levels and the support is present at $10.28 levels. The resistance is present at $10.58 levels, and a breakout above this level can push the prices higher. The digital asset is currently trading in a range-bound zone, and a breakout of this range can.

MACD line (blue) is close to crossing above the signal line, which is a bullish sign, while the RSI is currently at 56 levels, which shows that the digital asset is neither overbought nor oversold levels. The Moving Average is currently trading at $10.40 levels, and a bearish crossover can be seen as the prices correct lower.
Neo price analysis conclusion
To conclude, Neo price analysis, there has been a rise in today’s price as the bulls are trying to situate themselves on the price chart.NEO/USD price is now at the $10.56 level, encouraging the buyers. From a technical standpoint, Neo price analysis shows that the digital asset has broken out of a descending triangle pattern, which is a bullish sign. The breakout has occurred with good volume, which is another bullish sign.
Disclaimer. The information provided is not trading advice. Cryptopolitan.com holds no liability for any investments made based on the information provided on this page. We strongly recommend independent research and/or consultation with a qualified professional before making any investment decisions.
 cryptopolitan.com