The Tron price analysis reveals the bullish trend has been continuing for today, and the uptrend has benefited the coin value significantly. The TRX/USD price has been able to challenge the resistance present at $0.074 as well and seems to be breaking above this resistance because of the upsurge. The price is currently at $0.074 and is expected to increase even further.
TRX/USD 1-day price chart: Bullish momentum uplifts price to the $0.074 mark
The one-day Tron price analysis is confirming an uptrend, as the price has been rising consistently since yesterday. The progression has been quite noteworthy as the price has been able to break past the resistance level present at $0.072 yesterday. The price has taken a momentary stop at $0.074, and it is expected that it will jump to further heights soon. The moving average (MA) value is at a lower level and stands at $0.072.
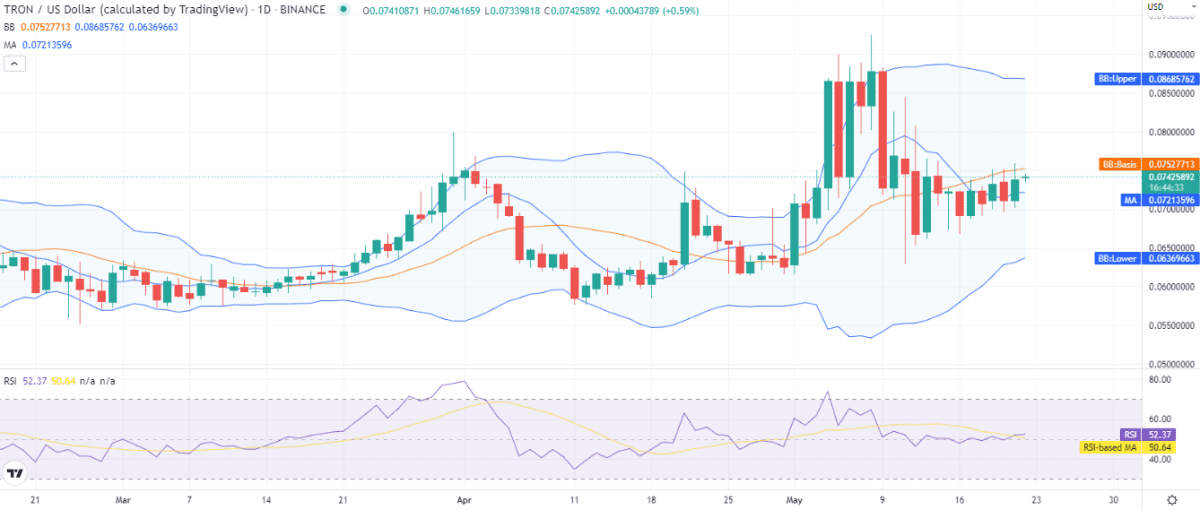
The volatility is on the higher side, which indicates that the price might keep following the upwards trend. The upper and lower values of the Bollinger bands Indicator have changed as such; the upper value is now at $0.086 while the lower one is at $0.063. The Relative Strength Index (RSI) indicator is present at index 52 with a slight upwards curve.
Tron price analysis: Recent developments and further technical indications
The four-hour Tron price analysis is also predicting an uptrend for the cryptocurrency as the price has been progressing at a moderate pace. TRON’s price is now settled at $0.074, and there is a high chance that it will move forward in the approaching hours. The price breakout was downwards at the start of the trading session, but it started moving upwards after four hours; the improvement in coin value has been surprising, and it seems that the buyers are inclined toward keeping the price high. Moreover, if we discuss the moving average value, then it is currently present at $0.072.
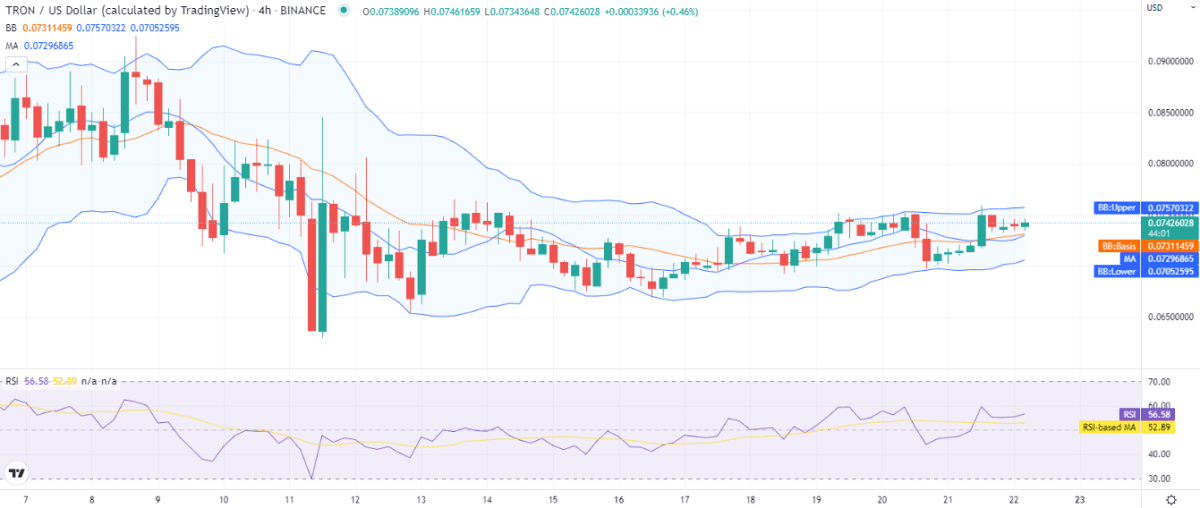
As the volatility has been low on an hourly basis, the Bollinger bands are now keeping their average at $0.073 above the MA value, but MA seems to be crossing over soon. Whereas the upper and lower Bollinger band values have moved to the following levels; the upper value to $0.075 and the lower one to $0.070. The RSI score has been increasing and is trading in the upper half of the neutral zone to reach index 56 as well.
Tron price analysis conclusion
The above one day and four hours Tron price analysis is predicting a rise in price as a constant uptrend has been following for the last 36 hours. The price has crossed through the resistance levels as well and has joined the $0.074 position. Further increase in the coin’s price is possible if the support from buyers remains steady.
Disclaimer. The information provided is not trading advice. Cryptopolitan.com holds no liability for any investments made based on the information provided on this page. We strongly recommend independent research and/or consultation with a qualified professional before making any investment decisions.