Dogecoin price analysis shows bearish signs today, continuing along the same trend from over the past 3 days. DOGE price has stagnated around the $0.08 mark and moved as high as $0.085 over the past 24 hours, incurring a 2 percent gain. However, Dogecoin has largely failed to find a sustained push upwards since the massive crash occurred on May 11, 2022. Recent price action suggests that price has stagnated around the current trend, and price will have to move downward before launching any uptrend. Immediate support also sits close to the current trend at $0.082, and price will have to retrace down to the second support zone at $0.078 to attract buyers into the market.
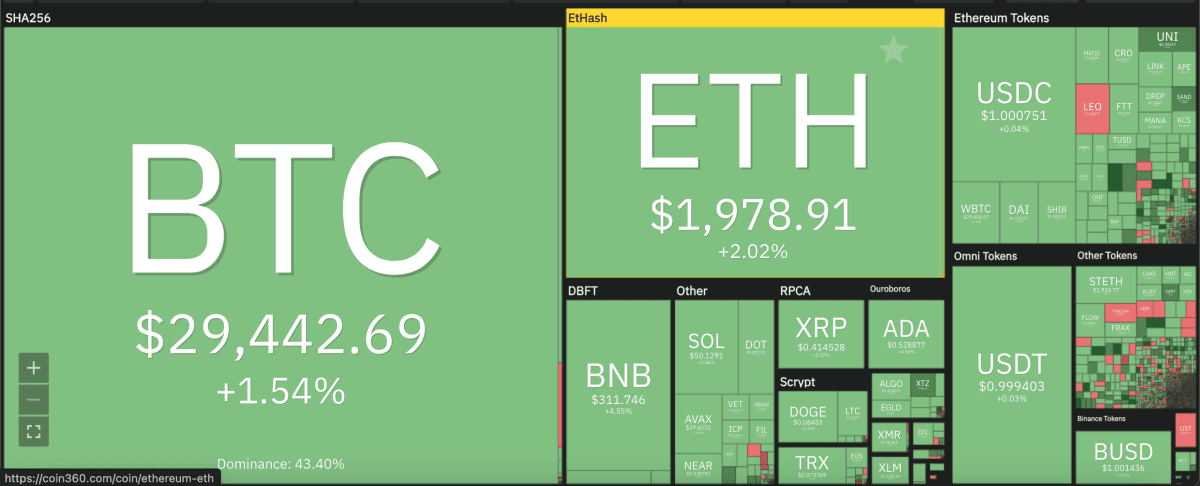
The larger cryptocurrency market showed some promise during the day’s trade as Bitcoin rose up to $29,500 with an almost 2 percent increment. Ethereum also moved within touching distance of the $2,000 mark, gaining 2 percent, as major Altcoins also showed similar gains. Cardano rose up to $0.53 with a significant 5 percent uptrend, whereas Ripple gained 2 percent to move up to $0.41. Solana and Polkadot moved also jumped 2 percent each, to move as high as $50.12 and $9.87, respectively.
Dogecoin price analysis: DOGE market valuation declines significantly on 24-hour chart
On the 24-hour candlestick chart for Dogecoin price analysis, price can be seen forming a rectangular pattern, which suggests price stagnation around the current trend. DOGE price has failed to breakout from the $0.85 barrier set since May 17, 2022, and technical indicators suggest price may have to trend downward before moving up. The immediate challenge will be to breach the crucial 50-day exponential moving average (EMA) at $0.89 which also constitutes the next resistance point. Sellers may also target that point to trigger sell-offs and get out of a stagnating market.
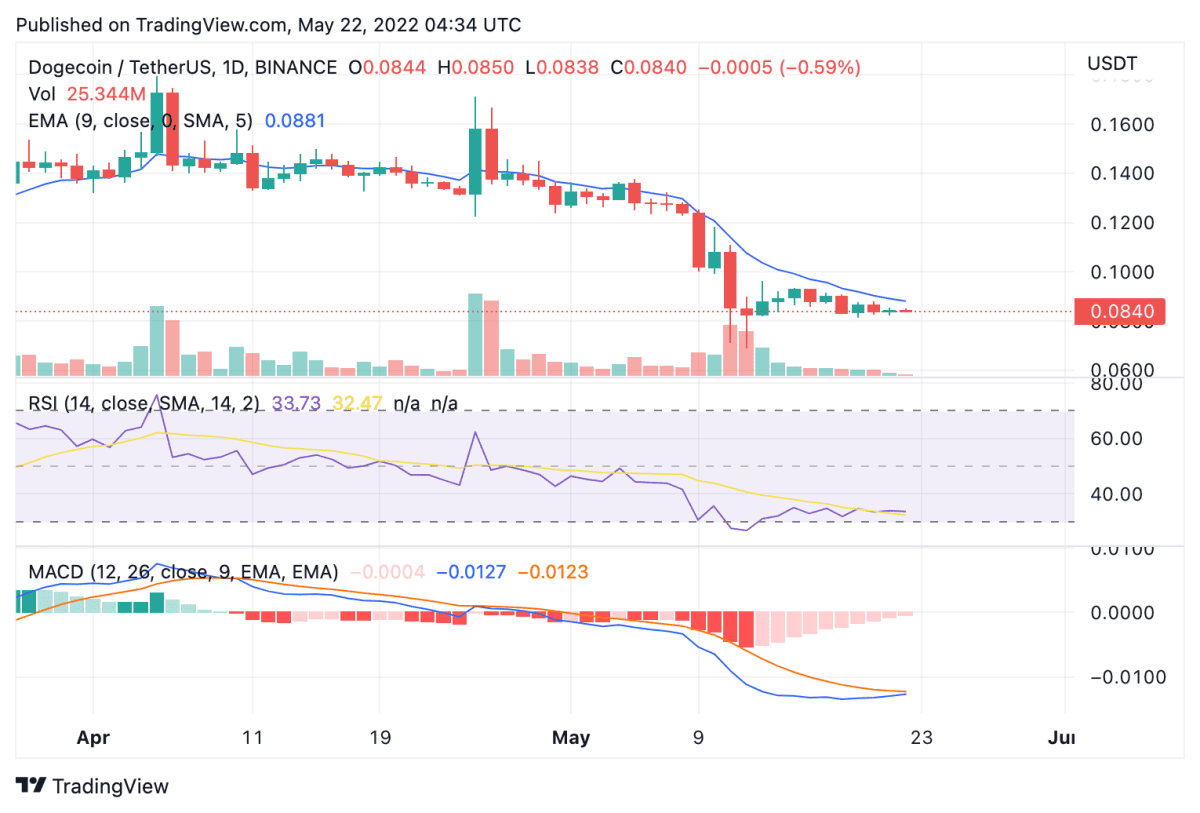
Further reenforcement of that narrative is provided by the 24-hour relative strength index (RSI) that continues to stride along a straight line in the oversold region. Its value at 33.68 is steadily decreasing, while a 19 percent drop in trading volume also suggests the same. In addition, the moving average convergence divergence (MACD) curve is forming lower highs and is expected to break away from the neutral zone over the next 24 hours to make a bearish divergence. Conversely, upward consolidation will be capped before the $0.1 mark where further seller pressure is expected.