As the cryptocurrency market takes a flight to meet the bull, Litecoin [LTC], on Sunday, soared over 11%. At the time of writing, the coin was trading at $26.2, with a market cap of $1.5 billion. The 24-hour volume was set at $376.8 million.
1-hour
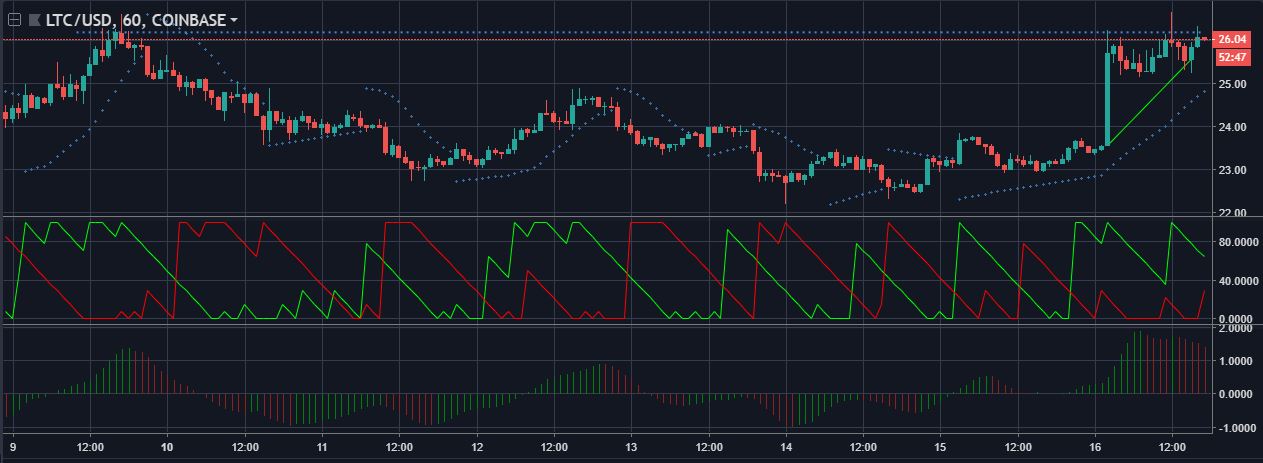
Litecoin 1-hour candlesticks | Source: tradingview
The one-hour candlesticks of LTC are seeing a steep uptrend stretching from $23.5 to $25.5. Here, the resistance is set at $26.2 level. Furthermore, the uptrend is forming an ascending triangle with the resistance, wherein there is a possibility of a resistance-breach.
The Parabolic SAR is currently bullish on Litecoin. This is suggested by the dots positioned below the candlesticks to provide support.
The Aroon indicator is showing a weakened green trend than earlier. However, the uptrend is still stronger than the downtrend. Therefore, the indicator is bullish on the market.
The Awesome Oscillator is highly bearish on the cryptocurrency, disagreeing with the above indicators.
1-day
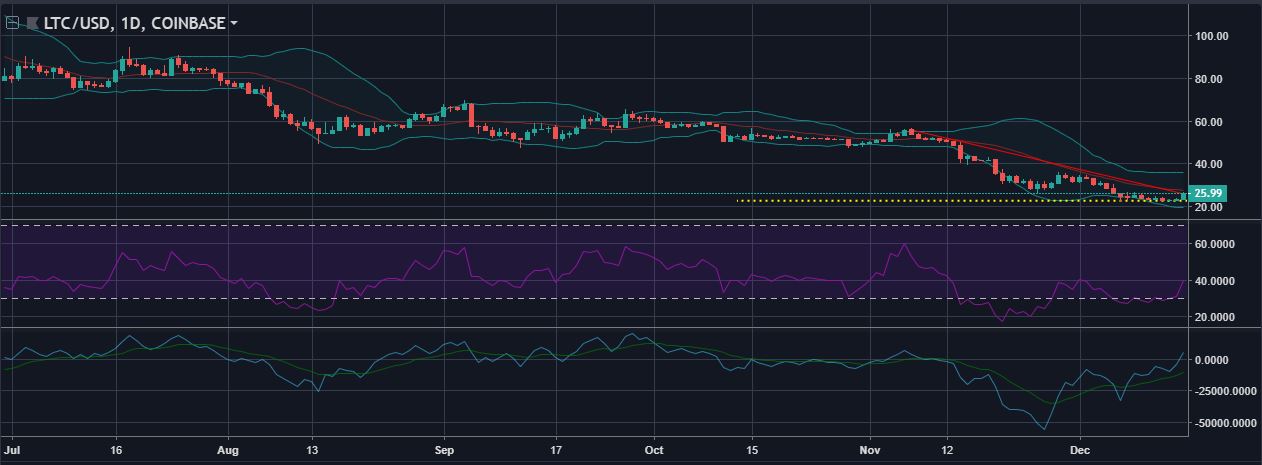
LTCUSD 1-day candlesticks | Source: tradingview
In the one-day time frame, it can be observed that a steep downtrend is projected by the graph, stretching from $55.8 to $26 with a support level fixed at $22.8. The downtrend is forming a descending triangle with the support, depicting a decline in the long-term LTC market.
The Bollinger Bands narrowed down the bottle-neck but are back to diverging to provide space for price fluctuation. A higher volatility can be expected in the Litecoin market after the recent trend breakout.
The RSI was travelling in the overbought zone but is now attempting to move upwards. However, the indicator is still in the bearish zone.
The Klinger Oscillator is extremely bullish on the market as the reading line made a bullish crossover and is still moving upwards to side with the bull.
Conclusion
In this technical analysis, the majority of the indicators are clearly siding with the green trend in LTC’s future. The Bollinger bands are depicting a higher volatility in the market as well.