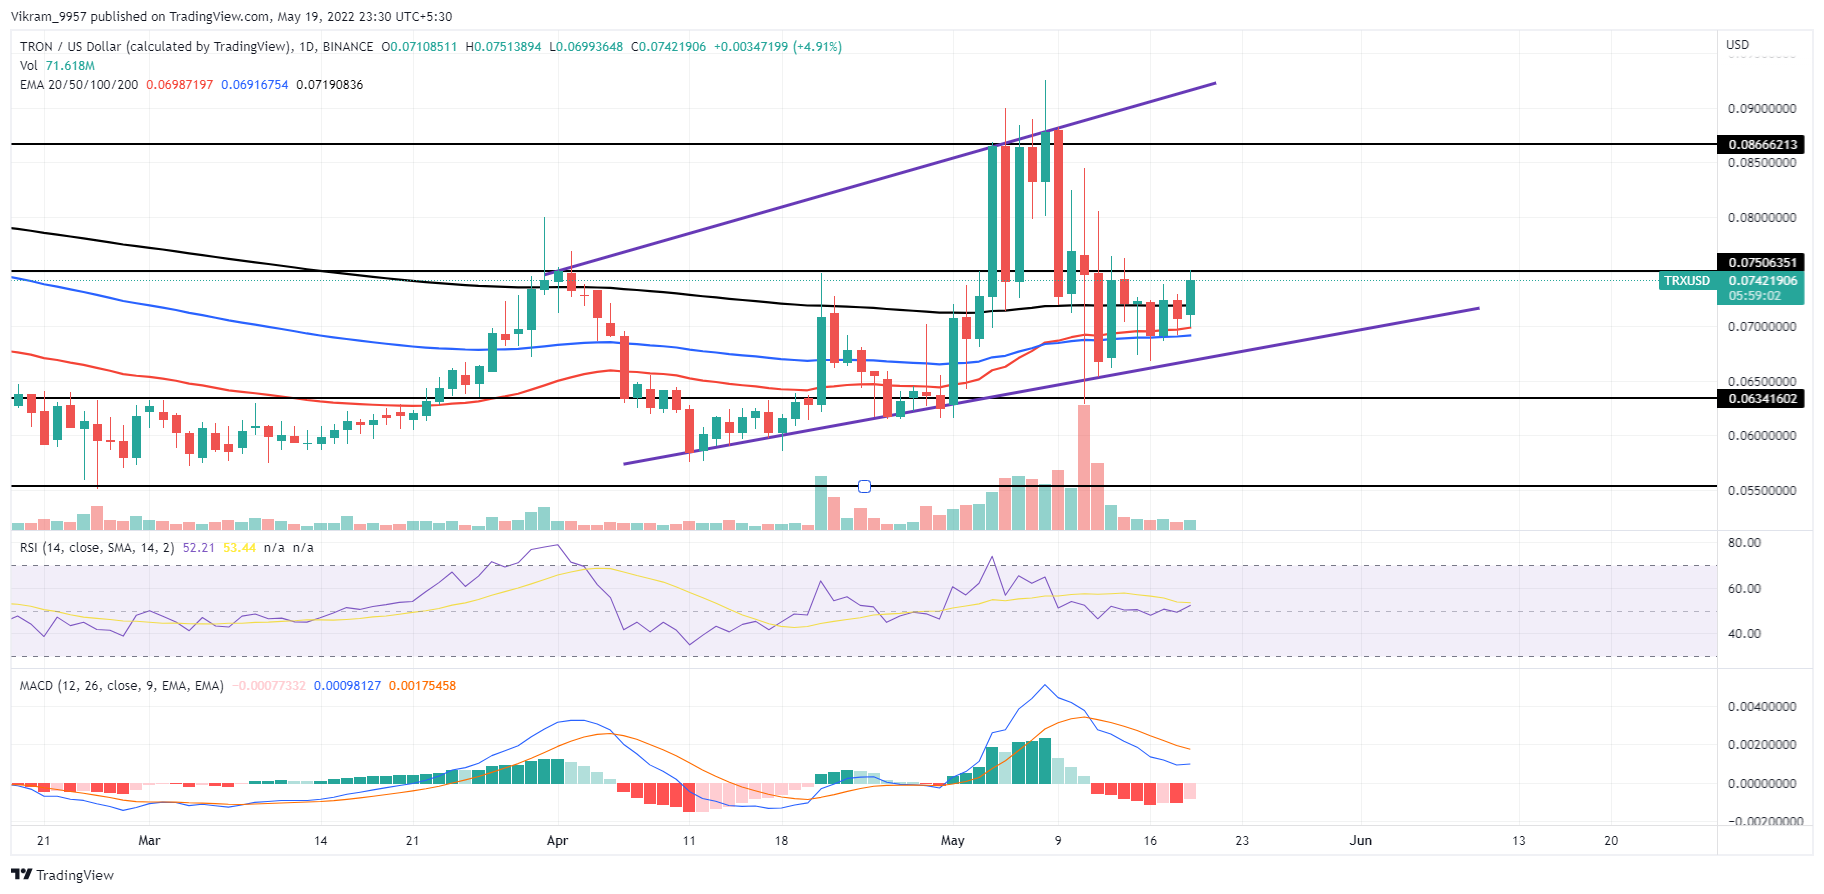
TRX prices reflect an increase in the underlying bullishness as the growing market value prepares to surpass the $0.075 barrier. Key technical points:
- TRX prices have increased by 4.76% in the last 24 hours.
- The RSI values present an increasing bullish influence on the price trend.
- The 24-hour trading volume of Tron is $1.031 Million, reflecting an 8% rise.
Past Performance of TRX
TRX prices experienced a surge in buying pressure with the start of April, resulting in a bullish spree above the 200-day EMA and reaching $0.085. The bull run accounted for a price jump of more than 35% within the first week of April. However, due to the LUNA controversy, the market value of TRX declined sharply, undermining all the bullish growth and reaching the 50-day EMA.  Source-Tradingview
TRX Technical Analysis
After approaching the 50-day EMA, we can see a halt in the downtrend and an increased number of bullish breakout attempts above $0.075. The recent effort shows a 4.76% bullish engulfing candle breaching the 200-day EMA with increased trend momentum. The crucial daily EMAs maintain a sideways flat trend, but the recent 100 and 50-day EMA bullish crossover projects a rise in underlying bullishness. Moreover, the declining bearish spread between 50 and 200-day EMA increases the chances of golden crossover. The RSI indicator increases bullish influence on the price trend as the RSI slope hikes above the halfway line with a parabolic recovery. Hence, the surcharge in RSI values increases the chances of a bullish breakout. The MACD indicator reflects a rise in the fast line after a steep downtrend projecting a high likelihood of a trend reversal bringing a bullish crossover. In short, the TRX technical analysis projects a much more likely scenario of a bullish breakout.
Upcoming Trend
TRX prices will surge higher with an extreme rise in trend momentum upon the $0.075 breakout to retest the $0.085 high. Moreover, the increased speed makes a much more likely possibility of a bullish breakout to reach $0.10. However, a reversal back to 50-day EMA can be seen upon bullish failure. Support Levels: $0.065 and $0.057 Resistance Levels: $0.075 and $0.085
 cryptoknowmics.com